EURGBP Case Study
 It is not news that news moves financial markets. This blog will publish research on how, when, why, and which news moves what financial markets.
The Euro against the Pound (EURGBP) exchange rate accounts for only 5% of FX trading according to the BIS. It is not a major currency pair, but today I thought I'd give it a quick once over to demonstrate some issues that have been showing up so far.
Also the U.S. International Trade Balance (ITB) is a long-runnning announcement and an important one for foreign exchange rates however it the economic derivatives data for it has a short history.
 ITB is the monthly estimate of the balance of payments on U.S. International trade in goods and services, expressed in billions of current U.S. Dollars, for the calendar month which is two months prior to the month in which such estimate is scheduled by the U.S. Department of Commerce to be released. ITB is available from February 2005.
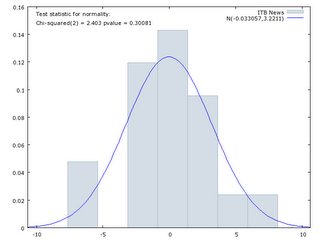
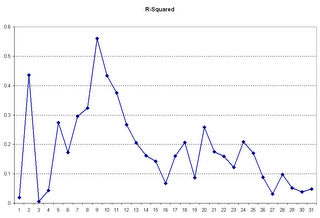
So what can I show you when the currency is not one of the most-traded and there is not a lot of derivative-based expectations data. Quite a lot actually. I start with the news (measured as the expected number from derivatives prices minus the actual): Then using this to explain the cumulative returns for the EURGBP for the minutes following the ITB announcement days I find that the best fit (in terms of R-squared is 8 minutes after the 8:30am annnouncement - shown as 9 in the chart below since the first return is from 8:29am to 8:30am). There is also a peak at 1 minute, but the best fit is at 9. Notice how sensitive the fit of the model is to the cumulative return window, choose a window of 30 minutes the R-squared is 0.05 as opposed to 0.56 at 8 minutes:
 The same pattern can be seen in the news coefficient and its significance (shown by the t-Statistic):
 So the return window is critical to finding a significnat news effect.
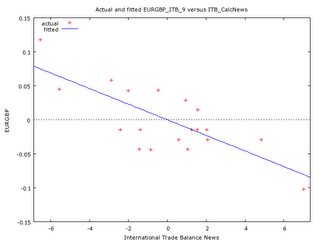
The EURGBP has relatively symmetric response to good and bad news. This can be seen in the plot of news against the 8-minute cumulative return:
 If we split the good and bad news we get similar coefficients:
| VARIABLE COEFFICIENT STDERROR T STAT P-VALUE |
| ITB_PosNews -0.0111799 0.00356628 -3.135 0.00604 *** |
| ITB_NegNews -0.0117322 0.00343696 -3.414 0.00331 *** |
| VARIABLE COEFFICIENT STDERROR T STAT P-VALUE |
| ITB_CalcNews -0.0111298 0.00240619 -4.626 0.00024 *** |
| ITB_CalcSkew -0.0178708 0.0158213 -1.130 0.27436 |
 With the addition of the skewness of expectations I am now explaining 59% of the return in the EURGBP return after a U.S. Trade Balance announcement.
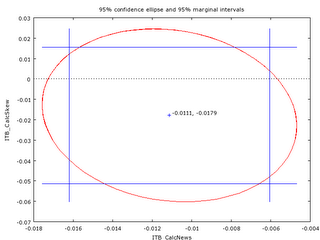
And what confidence can I attach to the significance of these two coefficients affecting EURGBP returns? Here's the confidence intervals for the two parameters, you'll notice that the skewness parameter confidence interval includes zero so it is debatable whether it should be kept. Because it lowers the root mean squared error (t-stat greater than 1.0) it was kept:
 So while there is still not a lot of data on economic derivatives for the Trade Balance and the EURGBP is not a currency you would expect to be moved by the data nonetheless there is a strong statistical relationship that can be modeled (and exploited?).

0 Comments:
Post a Comment
<< Home