Wednesday, March 21, 2007

Correlation of Currencies - Normal and Stressed

Correlations can be useful tools.

FX Traders often use them to confirm movements following an announcement. For example, if a trader is expecting the EUR to appreciate following a retail sales announcement and the EUR has a negative correlation with the CHF and a positive relationship with the GBP then these currencies might be tracked to make sure the movement in the EUR is one to take advantage of.

Correlations are useful but can change in stressful times. In times of extreme financial stress correlations head toward 1 and -1. This is the contagion effect, when safe harbours disappear.

When economic news affects financial markets correlations strengthen as volatilities rise. It is important then that market participants use the right correlation for the right situation.

A while ago I posted some correlations that looked at FX rates a few minutes after major announcements. Here is the link to these posts.

Tables at mataf.net (Currencies Price Provided by the Swiss broker RealtimeForex) give correlation of currencies in more normal times. According to the website:

  • If the correlation is high (above 0.8) and positive then the currencies move in the same way.
  • If the correlation is high (above 0.8) and negative then the currencies move in the opposite way.
  • If the correlation is low (below 0.6) then the currencies don't move in the same way.
These correlations for 5, 20 and 100 day periods will tend to average out the extremes that are experienced during announcement days and so will tend to be lower.

So correlations tend to be higher at times of stress and following economic announcements. Here is the proof.

I have taken the average correlations (currency pairs of currencies shown below with the USD vs. EUR/USD) following four major U.S. economic announcements: CPI, initial jobless claims, nonfarm payrolls, and retail sales. The correlations are plotted for data 1, 5, 10, 20, and 30 minutes following these announcements. Using the mataf.net data I also plot the 5, 20, and 100 day correlations alongside:The correlations on the right hand side of the chart are for more "normal" times.

The correlations on the left hand side of the chart are for more "stressful" times.

Notice how currencies that tend not to move together at the daily frequency do move together after annoucements. Also there is a trend towards greater positive or negative correlation the closer one gets to the announcement.

If anyone would like a spreadsheet of my calculation of the 1, 5, 10, 20 and 30 minute return correlation matrices for the U.S. announcements of nonfarm payrolls, initial jobless claims, retail sales, and CPI, please send me an email to john.parker at relevanteconomics.com.

Labels: , ,

Friday, February 23, 2007

Consensus Forecasts and Herd Mentality

This is the third and final note about a post by the FX guru of Nova Scotia, Tom Yeomans, entitled “Is news trading dead?”

Tom talks about how FX trading around economic announcements has changed over the last few years. He then outlines a view of the future of FX news trading that involves forecasting the announcement.

Since it is news (that is difference between the actual release and the market’s expectation just before the release) that moves the market you need not just a forecast but also a read on what the market thinks.

Tom discusses the use of consensus forecasts. He notes that “Usually they had 18-21 people making guesses. That always seemed a little suspect to me …”.

I have noted in another post about the problems with consensus forecasts.

However consensus forecasts can be made useful. In a paper on how forecasts can be used by financial institutions for risk management purposes I noted that surveys of forecasts can be used to develop scenarios for risk management and how …

This allows risk managers to understand their potential losses conditional on a range of forecasts. The average forecast and the dispersion in forecasts can be used to build a model of the distribution of market participants' expectations. The fitted model can then be used to extrapolate to large moves and thereby address the problems of sparse and clustered data. Finally, conditional scenarios can be used to mitigate the lack of coverage in forecast surveys.

Note that scenarios, based on forecasts, can also be used for speculating as well as risk management since the focus is on the entire set of possible outcomes and so scenarios paint a picture of the return and the associated risk.

Of course, for certain announcements getting a read on the market is easy since a full distribution of expectations can be had from auctions of economic derivatives.

Labels: , , ,

Thursday, February 22, 2007

Trading Scenarios

I’ve been thinking some more about a post by the FX guru of Nova Scotia, Tom Yeomans, entitled “Is news trading dead?” In a tremendously interesting and informative post, after chronicling the history, Tom outlines a view of the future of FX news trading.

He says that it seems now that he can’t straddle the market and he wants to avoid the chaos of the first few minutes after an announcement. As a result he says it is inevitable that he will have to make predictions of what the official numbers will be several hours prior to an important economic report. He suggests that a forecast within the framework of a money management system would permit the pyramiding trades early in the morning based on the assumption that we “know” what the economic report numbers will be. He goes on to suggest that this would more or less emulate the way a large brokerage or investment house would do it.

I agree. I think the most promising approach is to use range of outcomes (scenarios) conditional on a range of forecasts. This gives the likely return and the attendant risk associated with a particular position.

What would this look like? Well, right before certain big U.S. economic announcements we have the results of derivatives auctions that give us a very good view of the market’s expectation. The modeling that I have done links this expectation with market responses. For someone that is interested in the EURUSD following a non-farm payroll announcement, they might be interested the chart of the distribution of market expectations (link to example charts) and what the resulting return chart is for the EURUSD (example charts, and some more).

Labels: , ,

Wednesday, February 21, 2007

A Short History of News Trading

I’ve been thinking about a post by the FX guru Tom Yeomans entitled “Is news trading dead?” In a tremendously interesting and informative post Tom documents his experience in news trading as:

  • 2003-4 Straddling – Traders would place an order 15 pips above and below current price 30 seconds prior to the release of an important economic report. No matter where price went, the trader would profit. Straddling worked well and brokers guaranteed fulfillment of the order.
  • Whiplashing the Straddlers - My understanding is that in response to straddling, brokers increased spreads and took the waiting orders, then decreased the spread and filled the waiting orders, triggering stops all over the place seconds prior to the report being released. That move (called a whiplash) ended straddling.
  • Tick trading - This trading exploited the delays in updating currency pairs.
  • Delayed correlation signals – using the correlation of the USDCAD against the EURUSD to give entry and exit signals. Tom still uses the correlations but not the same way since the correlations are not as useful.
  • News trading – Quote from “Is news trading dead?”: “When I first began trading economic numbers, I did it with B’berg on the web and constantly refreshing my browser or searching around for a feed that gave me them fairly quickly. I usually had a few minutes to place my trade, have it accepted, and then a few sips of coffee before it began to move. That was on the EURUSD in 2006. It often took up to 20 minutes before the UK based reports moved the market. I am dead serious.”
  • News Arbitrage - Summer 2006 - thousands of people, faster entry, special brokers, and software began to scalp the market immediately after a report. As a result the spreads have widened prior to big reports. Mr. Yeomans might be somewhat responsible for this as he has been successfully training people to trade the news for some time.
  • Wait and see – Tom now sets his triggers higher knowing that noise created by people jumping in and out during the first minute creates chaos. These days, Tom waits to see confirmation of the move in a clear, sustained direction. By waiting an extra minute or so to see the move going in the correct direction means that he can execute his trade when the spreads have dropped back to normal. The idea is to still base the trade on the economic numbers and results, but to increase the lot size of the trade while forfeiting the early gains of the move. By placing larger bets he hopes to get the same payoff as before news trading became so popular.
Tom has adapted to market conditions and continues to do so. Next I’ll discuss Tom’s view of the future of FX news trading and how I think it can be realized.

Labels: ,

Tuesday, February 06, 2007

Really Useful Correlations

It is not news that news moves financial markets. This blog will publish research on how, when, why, and which news moves what financial markets.

A couple of days ago Tom Yeomans commented on my blog that correlations can be tools for fundamental traders. He pointed me to Mataf who publish a running website update on the correlations of forex pairs.

I looked at these correlations between FX rates for 5, 20 and 100 days. These would be useful for normal markets. But often contagion effects hit financial markets. During periods of high volatility or market stress correlations have a tendency to go to 1 (or -1).

After a major economic announcement, there are, as I have demonstrated, some interesting relationships. I thought, following Tom’s suggestion, I would look at correlations just following announcements. So here are a couple of the correlations that should be really useful to those trading announcements.

As an example, from Mataf the 5, 20, and 100 day correlations between AUD-USD and the USD-CAD were (when I pulled them on Monday, February 05, 2007 at 11:58 PM), 0.21, 0.47, and 0.68. According to the notes “If the correlation is low (below 60) then the currencies don't move in the same way.” Now the time horizon should match your holding period. So what if your holding period is a few minutes after an announcement?

Look at the same pairs 1, 5, 10, 20 and 30 minutes following a U.S. CPI announcement. I have calculated the correlations of the returns in the currency pairs (not the levels). If you are trading this announcement, these are the correlations you should care about. The numbers are -0.9035, -0.8479, -0.6696, -0.7454, and -0.6992.

As a sampler here is the return correlation matrix for 1 minute after an 8:30am U.S. CPI announcement:

AUD

CAD

CHF

EUR

GBP

JPY

1

-0.9035

-0.9429

0.9339

0.9552

-0.9135

AUD

1

0.9051

-0.8678

-0.859

0.8414

CAD

1

-0.9796

-0.9675

0.9065

CHF

1

0.9746

-0.915

EUR

1

-0.9431

GBP

1

JPY

And here it is 30 minutes after:

AUD

CAD

CHF

EUR

GBP

JPY

1

-0.6992

-0.8205

0.8551

0.85

-0.8357

AUD

1

0.7108

-0.6963

-0.6182

0.7065

CAD

1

-0.9831

-0.9072

0.9329

CHF

1

0.9318

-0.9465

EUR

1

-0.8725

GBP

1

JPY

Labels: , ,

Friday, January 26, 2007

More Hidden Treasures

It is not news that news moves financial markets. This blog will publish research on how, when, why, and which news moves what financial markets.

On Monday, November 06, 2006 in a post entitled “Recent Developments in How Economic Announcements Affect Financial Markets” I noted that the EUR and the CHF move in opposite directions when the U.S. trade news is announced. I expanded on this in the post on Wednesday, December 27, 2006, “Hidden Relationships”.

Here is another interesting discovery.

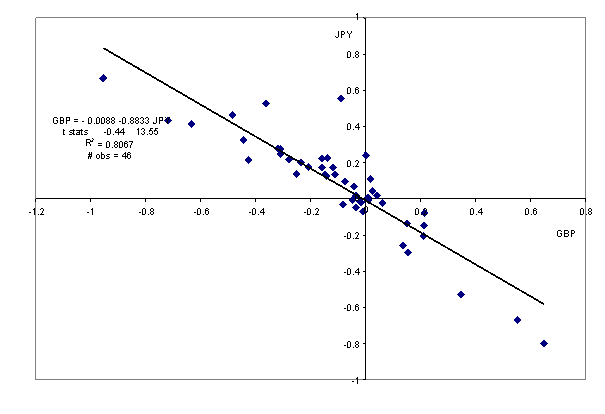
The Yen and the Pound appear, on average, to move in opposite directions to the U.S. Dollar when non-farm payrolls ("NFP") are announced. There may be some interesting profit maximizing strategies (or hedge opportunities depending on your perspective). Here is the chart of the historical relationship between the USD/JPY and GBP/USD (their 1-minute returns) after NFP announcements:

Labels: ,

Wednesday, January 24, 2007

Vote for your favourite FX rate!

It is not news that news moves financial markets. This blog will publish research on how, when, why, and which news moves what financial markets.

Here is your chance to direct my research. Vote for your favourite FX rate!

Based on the preliminary research I have done, I am about to embark on a comprehensive research exercise to document the best models for the impact on financial markets of the following announcements:

  1. U.S. Nonfarm Payroll
  2. U.S. Initial Jobless Claims
  3. U.S. Retail Sales (excludes autos)
  4. U.S. Core CPI (excludes food and energy)

I will be, in time, covering all major financial markets. I am starting with exchange rates. This is your chance to vote for your favourite exchange rate. The most votes gets the most coverage in my blog.

Send an email to me at john.parker@yahoo.ca with your favourite currency pair in the title. So the U.S. Dollar to Euro exchange rate will be identified as “EURUSD”.

It will help in my compilation if you use the ISO 4217 currency codes with the base currency being the first currency in a currency pair. The second currency is the quote currency, counter currency or terms currency.

Labels:

Wednesday, December 27, 2006

Hidden Relationships

It is not news that news moves financial markets. This blog will publish research on how, when, why, and which news moves what financial markets.

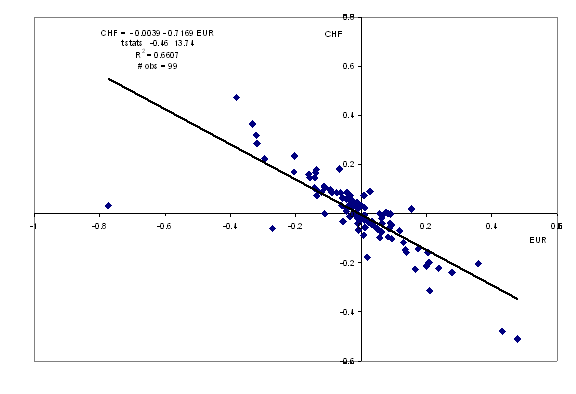
On Monday, November 06, 2006 in a post entitled “Recent Developments in How Economic Announcements Affect Financial Markets” I noted that the EUR and the CHF move in opposite directions when the U.S. trade news is announced.

Here is that relationship of the USD/CHF vs. EUR/USD 1-minute returns after International Trade Balance announcements:

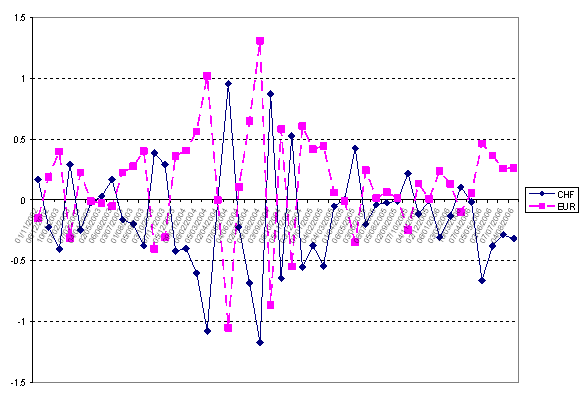
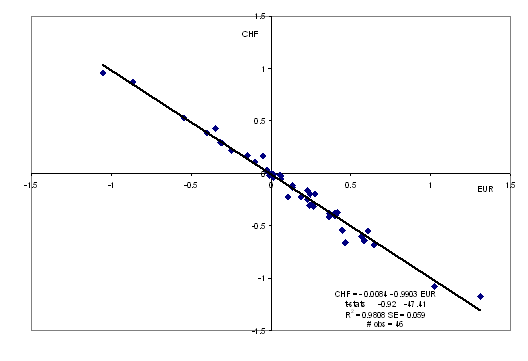
In another similar relationship, the Swiss Franc and the Euro appear, on average, to move in opposite directions to the U.S. Dollar when non-farm payrolls are announced. Both these effects are large and statistically significant. The graphs below shows initial returns of the two series just after the NFP announcement.

Time Series Graph of the USD/CHF and EUR/USD 1-minute returns after Non-Farm Payroll (NFP) announcements:

USD/CHF Vs. EUR/USD 1-minute returns after NFP announcements:In these case the announcement effect relationship, embodied in the estimate news parameters for each currency, can be subsumed in one estimate that is the ratio of the parameters, and assuming that the news coefficients are constant, so are the above relationships.

Labels: ,

Friday, December 22, 2006

For the FX Traders Part II - A Watch List of the Biggest Movers

It is not news that news moves financial markets. This blog will publish research on how, when, why, and which news moves what financial markets.

In the last post I gave a table of the most statistically significant FX moves. Another way of showing this information is to rank the table by the biggest moves. Since all of the results are highly significant anyway, and the results are for standardized news (see the post from Thursday, October 12, 2006 - Standardized News), we can compare them. Here is the ranking of the other top results (again ranked by the size of the response to news):
Financial Market Announcement
CHF NFP
EUR NFP
AUD NFP
JPY NFP
GBP NFP
CHF ITB
EUR ITB
CAD NFP
JPY ITB
GBP ITB
CAD ITB
AUD ITB
CAD GDP
CHF RSX
JPY GDP
CHF IJC
JPY RSX
CAD IJC
EUR HICP
JPY HICP
The biggest average historical move is for the Swissy (USD/CHF - Swiss franc) in response to the U.S. Non-farm payrolls (NFP). A bit of a surprise n'est-ce pas? And as a teaser, the coefficient is 0.291584. From this coefficient we can anticipate future moves once we have a view of the next announcement and the market expectation (from an economic derivatives auction). What else am I working on? I'm writing the specification and use case for an application that speculators and hedgers may find useful. This application would incorporate the results of my research and make the results more useful. More of this as it takes shape in the New Year.

Labels: ,

Monday, December 18, 2006

For the FX Traders - A Watch List of Currency-Announcement Pairs

It is not news that news moves financial markets. This blog will publish research on how, when, why, and which news moves what financial markets.

Today I thought all the forex traders who read this blog might be interested in which FX rates move the most to which announcements.

The top 20 effects for foreign exchange rates (ranked by the statistically significant news effects –measured by the absolute value of the t-statistic) are given below:

FX Rate

Announce-ment

EUR

NFP

CHF

NFP

CAD

NFP

JPY

ITB

GBP

NFP

JPY

NFP

AUD

NFP

CHF

ITB

EUR

ITB

CAD

GDP

GBP

ITB

AUD

ITB

CAD

ITB

JPY

HICP

EUR

HICP

JPY

RSX

CAD

IJC

CHF

RSX

CHF

IJC

JPY

GDP

The releases are as follows:

Announcements

Source

Frequency

Units

Release Time (Zone)

GDP (Advance Release)

BEA

Quarterly

% change qoq2

8:30am (ET)

Initial Jobless Claims (IJC)

ETA

Weekly

Thousands

8:30am (ET)

Non-farm Payrolls (NFP)

BLS

Monthly

Change in thousands

8:30am (ET)

Retail Sales Excluding Automobiles (RSX)

Census

Monthly

% change mom

8:30am (ET)

International Trade Balance (ITB)

BEA

Monthly

$ billion

8:30am (ET)

Harmonized Indices of Consumer Prices (HICP)

ES

Monthly

Index

11:00am (CET)

Manufacturing PMI (ISM)

ISM

Monthly

Change in the index

10:00am (ET)

1: Acronyms are as follows: BEA (U.S. Department of Commerce Bureau of Economic Analysis), BLS (U.S. Department of Labor Bureau of Labor Statistics), Census (U.S. Census Bureau), ETA (U.S. Department of Labor Employment & Training Administration), ISM (Institute for Supply Management), PMI used to be an acronym for Purchasing Managers’ Index, ES (European Union Eurostat), CET (Central European Time), ET (Eastern Time)

2: Expressed at an annualized rate.

Here the news coefficients were standardized. I define standardized news (S) as the surprise divided the sample standard deviation of the news

Standardized news allows for comparisons of responses of different asset prices (here exchange rates) to different news.

A couple of comments on these results:

1. Non-farm payrolls (NFP) is a very important release for currencies.

2. The international trade balance (ITB) is also important.

3. The ISM Manufacturing PMI Index (ISM), which does not show up in this list, is still statistically significant for some currencies.

4. The combinations of: CHF/GDP; AUD/GDP; GBP/GDP; GBP/ISM; JPY/ISM; GBP/HICP; EUR/GDP are not statistically different from zero.

Labels: ,

Monday, November 13, 2006

CAD and GBP (and EUR summary)

It is not news that news moves financial markets. This blog will publish research on how, when, why, and which news moves what financial markets.

Again I look at the dataset from the Forex Resource Guide Excel Spreadsheet Version of News History 10/27/06. While a slightly less rigourous dataset than I usually use, it is an interesting comparison. This data uses a market expectation from surveys and the change in the exchange rate is a subjective measure. The data is also a bit sparse and so there are fewer questions that can be answered from it. Nonetheless, it provides an interesting comparison to my other results.

Since the votes from the last post were tied as to whether I should address the GBP or the CAD next I did both (it was a 0-0 tie ).

Unlike the EUR where a lot of announcements are statistically significant, for these currencies, there is only one significant announcement. For both GBP and CAD the news from the announcement itself (measured as actual minus expected) was significant in both cases.

For GBP the average move was 17 pips (t-stat 3.9, R2 0.24), but none of the announcements were important in explaining the currency moves after the announcements. Those included:

  • CPI
  • Current Account Balance (Quarter)
  • GDP q/q
  • Industrial Production
  • PMI Manufacturing
  • PPI Input s.a.
  • Retail Sales
  • Trade Balance (Visible)

The only announcement that was significant was the Trade Balance in the CAD model. The effect of the announcement was a move in the CAD of 24.6 pips (t-stat 1.9, R2 0.39). The effect of the news in this model was -1.42 (t-stat -4.3). Other announcements that were tested for the CAD were:

  • Consumer Price Index (MoM)
  • CPI ex Core 8 (MoM)
  • GDP m/m
  • Net Change in Employement
  • Retail Sales
  • Retail Sales (Ex Auto)
  • Trade Balance

Bottom line for this dataset

Important announcements by currency:

  • GBP – none more than another. Average news effect move 17 pips.
  • CADTrade Balance (24.6 pips); Average news effect move -1.4 pips.
  • EUR - GDP Annualized (37.7 pips); Change in Nonfarm Payrolls (25.1 pips); Existing Home Sales (-24.9 pips); PPI Ex Food and Energy (19.9 pips); Average news effect move -0.2 pips.

Labels: ,

Thursday, October 26, 2006

EURGBP Case Study

It is not news that news moves financial markets. This blog will publish research on how, when, why, and which news moves what financial markets. The Euro against the Pound (EURGBP) exchange rate accounts for only 5% of FX trading according to the BIS. It is not a major currency pair, but today I thought I'd give it a quick once over to demonstrate some issues that have been showing up so far. Also the U.S. International Trade Balance (ITB) is a long-runnning announcement and an important one for foreign exchange rates however it the economic derivatives data for it has a short history.

ITB is the monthly estimate of the balance of payments on U.S. International trade in goods and services, expressed in billions of current U.S. Dollars, for the calendar month which is two months prior to the month in which such estimate is scheduled by the U.S. Department of Commerce to be released. ITB is available from February 2005.

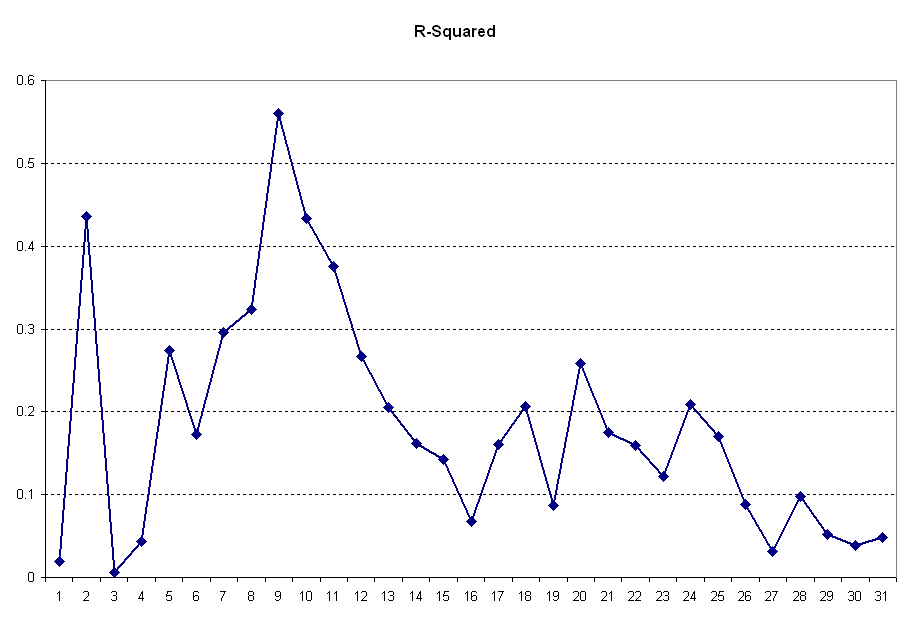
So what can I show you when the currency is not one of the most-traded and there is not a lot of derivative-based expectations data. Quite a lot actually. I start with the news (measured as the expected number from derivatives prices minus the actual): Then using this to explain the cumulative returns for the EURGBP for the minutes following the ITB announcement days I find that the best fit (in terms of R-squared is 8 minutes after the 8:30am annnouncement - shown as 9 in the chart below since the first return is from 8:29am to 8:30am). There is also a peak at 1 minute, but the best fit is at 9. Notice how sensitive the fit of the model is to the cumulative return window, choose a window of 30 minutes the R-squared is 0.05 as opposed to 0.56 at 8 minutes: The same pattern can be seen in the news coefficient and its significance (shown by the t-Statistic): So the return window is critical to finding a significnat news effect. The EURGBP has relatively symmetric response to good and bad news. This can be seen in the plot of news against the 8-minute cumulative return: If we split the good and bad news we get similar coefficients:

VARIABLE COEFFICIENT STDERROR T STAT P-VALUE

ITB_PosNews -0.0111799 0.00356628 -3.135 0.00604 ***

ITB_NegNews -0.0117322 0.00343696 -3.414 0.00331 ***

So it is not worth distinguishing between good and bad news. What about higher moments of the expectations distribution? It turns out the skewness of the expectation matters (marginally):

VARIABLE COEFFICIENT STDERROR T STAT P-VALUE

ITB_CalcNews -0.0111298 0.00240619 -4.626 0.00024 ***

ITB_CalcSkew -0.0178708 0.0158213 -1.130 0.27436

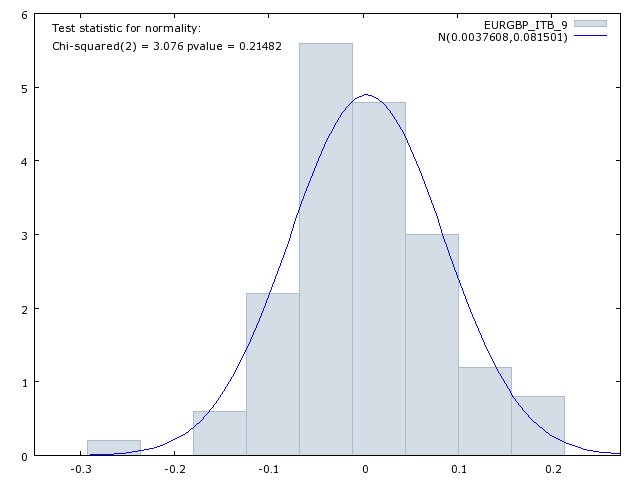
There is a bit of a skew to the cumulative return distribution too (compared to the normal): With the addition of the skewness of expectations I am now explaining 59% of the return in the EURGBP return after a U.S. Trade Balance announcement. And what confidence can I attach to the significance of these two coefficients affecting EURGBP returns? Here's the confidence intervals for the two parameters, you'll notice that the skewness parameter confidence interval includes zero so it is debatable whether it should be kept. Because it lowers the root mean squared error (t-stat greater than 1.0) it was kept: So while there is still not a lot of data on economic derivatives for the Trade Balance and the EURGBP is not a currency you would expect to be moved by the data nonetheless there is a strong statistical relationship that can be modeled (and exploited?).

Labels: ,

Monday, October 16, 2006

The Swissy and the Fiber - An Interesting Couple

It is not news that news moves financial markets. This blog will publish research on how, when, why, and which news moves what financial markets.

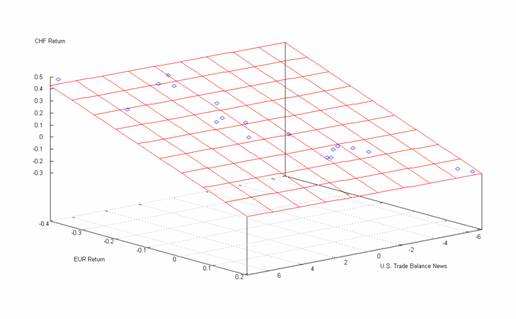
The chart below shows the relationship between the returns on the Fiber or Euro (EUR/USD) and Swissy or Swiss Franc (USD/CHF) right after the U.S. Trade Balance is released.

At 8:30am (Eastern Time), on a known date every month, this relationship has held.

I have made refinements in terms of differential effects of good and bad news, the volatility and shape of market expectations and so on, but as shown here this is a very simple relationship, the EUR and the CHF move in opposite directions when the trade news is announced.

Points in the bottom right quadrant above tend to be when bad news is released, points in the upper left is when a positive surprise hits the markets. By adding in the U.S. Trade Balance news as another dimension the relationship of these two currency pairs to the news can be seen. (There are less data points because this chart only shows the most recent announcements). Around economic news announcement times there are lots of correlations such as the one illustrated here. The underlying stable relationship that give rise to the moves is between financial markets and news. Do you have a comment on this relationship? Please post below any feedback you may have.

Labels: ,