It is not news that news moves financial markets. This blog will publish research on how, when, why, and which news moves what financial markets.
The announcement effect is defined as the impact of news on financial markets. News is defined as the difference between the market’s expectation of the release and the actual release (before any revision).
Theory tells us that it is only news or the surprise component of a release that moves financial markets. The definition and measurement of news is therefore critical.
News (N) or surprise at time t is the actual released data (A) at time t minus the market expectation (E(A)) close to, but before, time t (δ> 0 but small, so the expectation is measured perhaps a few hours or at most a day or two before the announcement).
Nt = At – Et-δ(At)
In the case of economic derivatives, since 2003 the auction data I have used has come from the same day as the announcement. So for example the auctions on U.S. GDP will take place on Friday, October 27th (from 7 - 8am Eastern Time) and the release will be the same day at 8:30am.
In the early days of studying the announcement effect (early to mid-80's) researchers used model-based measures of market expectations. They used autoregressive models, modelling expectations as a weighted average of lagged actual data. Then came the theory of rational expectations and people realized that these models assumed irrational behaviour.
When I was writing my thesis I was exploring the idea of a compromise between rational expectations as an equilibrium condition and an autoregressive mechanism as a learning method to get to this equilibrium. A Kalman filter provided a useful mechanism to describe how the market learns.
Later people took existing surveys that asked people whow they felt about inflation or economic growth and turned this into quantitative information that could be used in econometric models.
Then firms began to survey market participants specifically for a number, a forecast of an upcoming release.
Since 1980 MMS International surveyed around 40 market participants weekly (in the U.S., 20 for the Canadian survey) for their forecasts of major economic indicators. The forecast medians are sold by Haver Analytics under a lease they signed with MMS. MMS no longer exists. MMS’s successor company is Action Economics.
For the Retail Sales (excluding autos) April 2005 release the following information was available from the survey: mean (and median) 0.5, standard deviation 0.3986. The standard deviation and mean are from Gürkaynak and Wolfers (2006). MMS published only the medians. Action Economics, from December 2003, provide mean, median, high, low, number of participants and standard deviation.
Survey data are available for the U.S. Canada Europe for a wide range of forecasts including: Policy Indicators; National Accounts Data: GDP, Consumption & Income; Industrial Production, Capacity Utilization; Housing Indicators; Consumer, Producer, Import, and Export Prices; Employment & Earnings; Manufacturing & Trade; International Trade; and Leading Indicators.
Since October of 2002 Goldman Sachs (Deutsche Bank is also listed as originators of these auctions) have held auctions for Economic Derivatives, the name they give to options on scheduled macro-economic statistics. The auctions are held with the Chicago Mercantile Exchange (CME) and recent auction results are published on the Goldman Sachs and CME web sites.
In these auctions, one can buy and sell options on economic data releases such as employment, retail sales, industrial production, trade balance, inflation, consumer sentiment and economic growth. The auctions typically last for about an hour and take place on the morning before or a few days before the release. To trade in the auctions one must have over $10 million in assets. There are some 120 participants (Estimates from a conversation with Goldman Sachs Economic Derivatives Group on September 11th 2006) in these auctions. At any auction there are 40 or so participants, some 80% or so of these are large and small hedge funds. Large investment banks and a couple of corporations make up the rest. The investment banks, while accounting for less 20% of the participants make up for more than 20% of the auction volume. The participants are split almost equally between the U.S. and Europe (with the majority of European companies being U.K.-based).
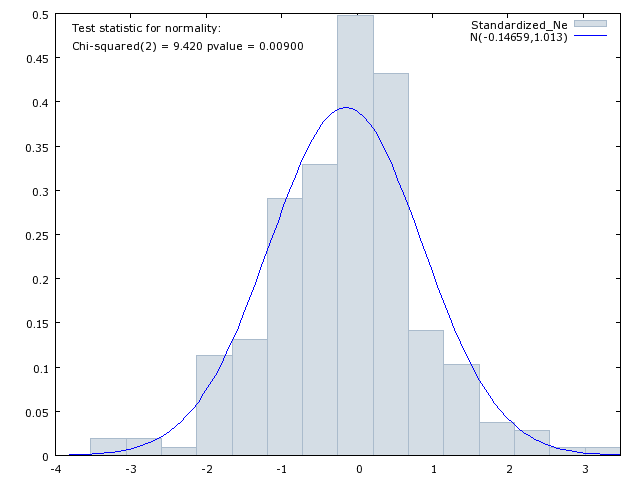
Goldman Sachs’ Economic Derivatives provide an advantage over other expectations measures in that from the auction results one can construct a probability density function of the market’s expectation for the economic release. On the left below is an example from the Retail Sales (excluding autos) auction of May 12, 2005 (for the same April 2005 release for which the survey data is given above). The implied distribution for the retail sales announcement can be generated from the reported auction clearing prices for the digital puts, calls, or digital ranges.
 Having expectations measured by a complete distribution has some advantages as we can test whether higher moments than the mean affect financial markets (such as the volatility, the skewness, and kurtosis).
As discussed above the expectation is taken just before the announcement (the closer the better). For the econoimc derivatives covered announcements, if δ is measured in days, the on average δ = 0.1 (excluding the HICP auctions which are 1 and 2 month options – as can be seen from the table below I have access to the 1-month option results).
|
| | | | | | | | | |
| | 40 | 45 | 19 | 7 | 46 | 32 | 38 | 227 |
|
| | 0.3 | 0.3 | 0.0 | 0.0 | 0.2 | 0.0 | 33.8 | 4.9 | 0.1 |
| | Sept. 04 | Nov. 02 | Feb. 05 | Jan. 05 | Nov. 02 | Feb. 04 | May 03 |
|
|
| | Aug. 06 | Sept. 06 | Aug. 06 | Jul. 06 | Aug. 06 | Sept. 06 | Aug. 06 |
|
|

Summary – Expectations Data
Apart from proving more information the Economic Derivatives or market-based forecasts are found by Gürkaynak and Wolfers to outperform the survey data. They:
“… establish that the Economic Derivatives forecast dominates the survey forecast (although survey forecasts perform quite well) both in predicting outcomes and in predicting market responses to economic news.” (p. 13)
And,
· “… that central tendencies of market-based forecasts are very similar to, but more accurate than surveys. Further, financial market responses to data releases are also better captured by surprises measured with respect to market-based expectations than survey-based expectations, again suggesting that they better capture investor expectations. Some behavioral anomalies evident in survey-based expectations – such as forecastable forecast errors – are notably absent from market-based forecasts.” (p. 1)
The Federal Reserve Board of San Francisco (2006) (Wolfers) took data from the first 153 of these Economic Derivatives auctions and compared them with an alternative forecast aggregator: the survey of the expectations of financial market analysts taken on the Friday prior to the data release. They asked “which better predicts the actual data?” The Economic Derivatives forecasts were slightly (5%–10%) more accurate, although these differences were not statistically significant. They also found more interestingly, once one knows the Economic Derivatives forecast, there is no useful information in the survey-based forecast.
They also analyze the change in stock and bond prices from 5 minutes before the announcement to 25 minutes later for the two alternative measures of news. In each case, they confirm that the Economic Derivatives market better predicts financial market responses to economic data than does the alternative survey-based measure.
Derivatives data is available for 7 series with the longest history going back monthly to September 2002. Survey data is available for some 170 series with the longest history going back weekly to 1980.
While the Economic Derivatives data is superior in terms of information content and usefulness for measuring the announcement effect, the survey data has a longer history and broader coverage. I use the economic derivatives data.
So "What's News?" Well I say it is the difference between what a financial market expects (and has built into prices) as measured by the implied forecast of an economic derivative auction and the actual release. A bit of a mouthful, but a useful definition nonetheless.
Labels: news

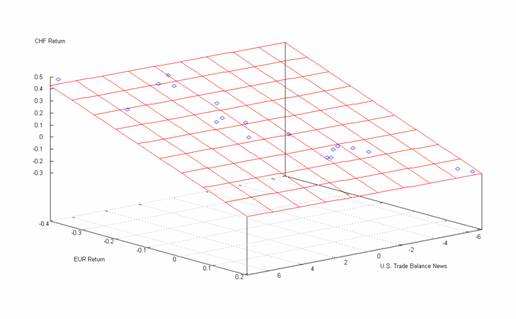
 While the news impact curve for volatility was defined some time ago, I think the same curve for the first moment is more interesting than that for the second moment. Don't you?
I'll be concentrating on the movement in the first moment, that is returns in financial markets. And in coming posts I'll show how some very simple, naive, rules can be used in combination with the (modified) news impact curve.
While the news impact curve for volatility was defined some time ago, I think the same curve for the first moment is more interesting than that for the second moment. Don't you?
I'll be concentrating on the movement in the first moment, that is returns in financial markets. And in coming posts I'll show how some very simple, naive, rules can be used in combination with the (modified) news impact curve.