Monday, November 27, 2006

Thresholds and Contagions, Particle Physics to Zoology to Finance - A Cross Pollination of Ideas

It is not news that news moves financial markets. This blog will publish research on how, when, why, and which news moves what financial markets.

In the Michaelmas 2006 (Volume 19 No. 1) issue of Oxford Today there was a report that Oxford zoologists were using a particle model from physics to explain why locusts swarm. “As locusts gather, individuals move around randomly – but only up to a point. Once there are more than 70 locusts per square meter, they spontaneously align themselves and all march together, devastating crops in their path”.

“Dr Jerome Buhl and his colleagues, reporting in the journal Science1, believe the mathematical rules will apply to a wide range of group animals, from fish to moose, and perhaps even to human crowds.”

The threshold effect is something I have wanted to test for the announcement effect. Once a financial market moves by a certain threshold amount then all of a sudden everyone moves together, producing a swarm effect. Traders often will set threshold for action and in aggregate this might explain why some announcements are a “scratch” from a trader’s perspective, that is there is a move but not enough to act upon. Once the threshold is breached though, lots of people want in.

The move from disorder to order or the contagion effect has been used to explain financial crises. Perhaps it can also be used to explain markets reactions to news too. Stay tuned for the result …

1Buhl, J., Sumpter, D.J., Couzin, I.D., Hale, J., Despland, E, Miller, E & Simpson, S.J. (2006) From disorder to order in marching locusts. Science, 312, 1402.

Labels:

Tuesday, November 21, 2006

The Story So Far ...

This blog shares research on the impact of economic news, that is, the difference between economic announcements and what was anticipated, on financial markets.

The three contributions of this research are:

  1. The market expectation is derived from economic derivative prices that allow a full distribution for the market expectation to be derived. Economic derivatives data better predict financial market movements and also allow for testing whether there is information in the higher moments of the distribution.
  2. High frequency financial data allows me to test for the optimal window and discover how long it takes financial markets to digest and react to news.
  3. By using a U.S. and a European economic announcement and a wide range of financial markets, this research compares announcements to show which are important for which markets.
Because of the focus of my readers I have recently been concentrating on foreign exchange rates and the big U.S. announcements.
  • I find that high frequency financial data leads to a much bigger and more significant news announcement effect over previous studies that used end-of day data.
  • Further, financial markets react very quickly to news. Unlike other studies that have assumed a 25-30 minute window, I have demonstrated that the announcement window is often just a matter of a minute or two.
  • Using the richness of the economic derivatives-based expectations data I have determined when higher moments of the expectations distribution are useful in determining the announcement effect (volatility of expectations, a skew in the market view etc.).
  • I also have shown in which markets, and for which announcements, good news and bad news have asymmetric effects; and, which markets are most responsive to which announcements.
  • Finally, I have highlighted some of the interesting results that traders or risk managers might want to delve into in more detail.
I am looking for feedback and ways to make the research useful. Should you have any suggestions for research direction or feedback, please leave a comment.

Labels:

Are the results stable over time?

It is not news that news moves financial markets. This blog will publish research on how, when, why, and which news moves what financial markets. Are the news effects estimated in this blog stable, or does the relationship change over time? It appears that the news coefficient stabilizes at around 25 observations. This suggests that there are sufficient expectations data from most of the derivatives auctions to estimate the news impact and for the results to be reliable. The length of the economic expectations data from derivatives auctions is listed here. The details of the stability tests follows. One way to assess stability of the news effect is to calculate the results using a recursive method that calculates the news coefficient of the simple regression with an expanding sample size. The results for a couple of exchange rates following the non-farm payroll announcements are plotted below:
CAD

GBP

The CUSUM or cumulative sum of the recursive residuals and the CUSUM of squares also provide indications of parameter stability. Below the CUSUM test and 5% confidence levels and no indication of parameter instability (when the blue line stays inside the red dotted lines the parameter is stable).

CHF

EUR

The charts below show the cumulative sum of squares test and 5% significance level and the “S” shape reflects what is shown in the recursive coefficients above, that is that there is some change in the exchange rate news coefficients around 15 observations and at 25 whence the coefficients become stable (again for this test when the blue line stays inside the red dotted lines the parameter is stable).

AUD

JPY

The U.S. International Trade Balance relationship was found by Faust et. al.* to be potentially one that has shifted over time. For my sample this does not appear to be an issue, probably because there are only 19 observations available from the derivatives auctions from February 2005 (when the Trade Balance derivatives auction was started) to August 2006. As for the nonfarm payrolls above, recursive residuals for the Trade Balance were calculated. There is some violation of the 5% confidence interval for the CUSUM of squares test but because this does not show up in the CUSUM or recursive coefficients tests it may be due to the error variance not being constant rather than the parameter.

In summary, it appears that the news coefficient stabilizes at around 25 observations. This suggests that there are sufficient expectations data from the derivatives auctions to estimate the news impact.

* Faust, Jon, Rogers, John H., Wang, Shing-Yi B., Wright, Jonathan H., (2003) “The high-frequency response of exchange rates and interest rates to macroeconomic announcements” U.S. Board of Governors of the Federal Reserve System, International Finance Discussion Papers, number 784.

Labels:

Friday, November 17, 2006

One To Watch - CPI News

It is not news that news moves financial markets. This blog will publish research on how, when, why, and which news moves what financial markets.

Around June 2006 the CME and Goldman Sachs introduced an auction of derivatives based on the Consumer Price Index - Core CPI ex Food and Energy announcement. More information can be found here.

This is an announcement to watch.

Because there is not much data yet it is early days to make decisions based on statistical analysis but indications are that this is becoming the key news event for the EURUSD.

Here is a summary of the findings:

  • The nonfarm payrolls (NFP) news was, as always highly significant.
  • The average move associated with the NFP announcement though was small.
  • Initial jobless claims had the smallest, and least significant impact on the exchange rate.
  • GDP and retail sales (RSX) news had large impacts.
  • The CPI however appears to have a huge impact. Because there have only been a couple of auctions, the effect needs to be confirmed.
There are some other interesting explanatory variables in this test that I will write more about soon.

For those that are interested, below are some details of the test.

The test was to take the change in the EUR very close to the 8:30 am time that many key U.S. numbers are released (CPI, GDP, nonfarm payrolls, retail sales, initial jobless claims, and the trade balance).

The change is taken as the 8:31am close minus the 8:29 am close. For the CPI, as an example, the resulting numbers are close to, but not exactly the same as those shown on the Forex Resource Guide for the CPI:

Then try to explain the move in pips (defined as the change the EUR times 10,000) or return (defined as the ratio of the natural logs times 100) with the news (actual minus the mean expectation from the derivatives auction).

This test uses all days, not just announcement days, and includes data for the news as explanatory variables. Because there are sometimes two announcements on one day, I threw all variables into one big regression and let the data sort out the best model. As I mentioned above there are some other ingredients that help explain how the market moves.

With news and other explanatory variables taken from the distribution of market expectations the model explains around 45% (adjusted R2) of the move in the EUR. I think this is quite impressive. Even more so because I have only six announcements included to explain the exchange rate.

Labels:

Tuesday, November 14, 2006

Myth: Revisions Are More Important Than The News

It is not news that news moves financial markets. This blog will publish research on how, when, why, and which news moves what financial markets.

There is a widely held myth that quite often large revisions in the nonfarm payrolls (NFP) overshadow the release itself.

In a previous post I noted, about an NFP release for Nov. 3rd 2006, that "There was some sentiment today that the revisions meant that although the number was lower than expected (however defined), the revision was above expectations and this might affect financial markets as much or more than the news itself."

I tested this and found that it was not true. Markets react to the initial news and not the revision.

NFP estimates “are presented as soon as sufficient data have been collected to meet standards of accuracy and reliability so that they can be used to guide policy decisions. Aggregate level estimates are published with the first release of preliminary data, usually 3 Fridays after the survey reference week. At this point, about 65 percent of the sample have been collected and used in the estimates. This is the number that the market reacts to. One month later, when over 80 percent of the sample has been collected, estimates are published for the first time for all of the detailed industries, and the second set of preliminary estimates are published for the aggregate levels. The "first final" estimates are published the following month, when over 90 percent of the sample reports have been collected.”

I took the two month lag of the revised data and included it with the initial news to see whether these revisions have any statistical effect on the EURUSD exchange rate returns one minute after the release.

The revision was not significant. It had a t-stat of 0.5 and a p-value of 0.62. Positive news and negative news were highly significant. The skewness and volatility of the expectations were significant enough to lower the mean squared error. The kurtosis of the expectations was not significant and the revision had the highest p-value (lowest t-stat).

Here is a sample of market commentary that suggests that the revisions move the markets:

  1. Examples 1 & 2 - “The eagerly awaited US October Non-Farm Payroll numbers were released today. Coming in at +92K, below the mean of a very wide range of estimates, it was eclipsed by revisions to the previous months: from +51K to +148K in September and from +188K to +230K in August.”
  2. “Forex Mid-Day Technical Report - Dollar Sharply Higher after Payroll Revision and Unemployment Rate - The same story again. The headline Non-farm payroll is disappointing, adding 92k jobs in Oct only comparing to expectation of 125k. However, prior month's data was revised sharply higher from 51k to 148k. Aug's data was further revised from 188k to 230k.
  3. Examples 3 & 4 – “The markets are eagerly awaiting the October reading of non-farm payrolls following the massive revisions made to the August figures. Payrolls are expected to rise 120K this month, but the focus may be on September revisions. The paltry 51K report last month did little to curb enthusiasm for the US economy, due to the Labor Department’s claim that the full revision for the year in March could be an astounding 810K.”
  4. “Although the September reading of US non-farm payrolls came in much weaker than expected at 51K, news that the Labor Department upwardly revised August’s figure by a whopping 188K offset any pessimism regarding the economy.”
  5. Example 5 - While markets were expecting a higher number of non-farm payroll employment for December, the strong revision on the November number should give some comfort to those that were expecting a stronger performance.”

6. Example 6 - US Non-Farm Payrolls (OCT) (13:30 GMT, 08:30 EST) Actual: 92.0K Eхpected: 123.0K Previous: 148.0K…How Did thе Markets React? US non-farm payroll is one оf thе most market moving pieces оf economic data for thе financial markets. аs a reflection оf thе overall Hеalth оf thе economy and a leading indicatоr for consumer spending, thе NFP report usually overshadows any othеr news in thе financial markets on thе day thаt it is releаsed. This wаs true for thе Fх and bond markets tоday, but not for thе stоck market. Both thе US dollar and bond yields shot uр after thе releаse оf payrolls. Even though thе Hеadline numbеr fell short оf eхpectations, thе prior figure for Septembеr wаs revised from 51k tо 148k, making thе 2 month average a respectable 120k. “

Financial commentators love to interpret market moves and attribute them to data. I love to do the same but I apply a bit more rigour to the process.

Labels:

Monday, November 13, 2006

CAD and GBP (and EUR summary)

It is not news that news moves financial markets. This blog will publish research on how, when, why, and which news moves what financial markets.

Again I look at the dataset from the Forex Resource Guide Excel Spreadsheet Version of News History 10/27/06. While a slightly less rigourous dataset than I usually use, it is an interesting comparison. This data uses a market expectation from surveys and the change in the exchange rate is a subjective measure. The data is also a bit sparse and so there are fewer questions that can be answered from it. Nonetheless, it provides an interesting comparison to my other results.

Since the votes from the last post were tied as to whether I should address the GBP or the CAD next I did both (it was a 0-0 tie ).

Unlike the EUR where a lot of announcements are statistically significant, for these currencies, there is only one significant announcement. For both GBP and CAD the news from the announcement itself (measured as actual minus expected) was significant in both cases.

For GBP the average move was 17 pips (t-stat 3.9, R2 0.24), but none of the announcements were important in explaining the currency moves after the announcements. Those included:

  • CPI
  • Current Account Balance (Quarter)
  • GDP q/q
  • Industrial Production
  • PMI Manufacturing
  • PPI Input s.a.
  • Retail Sales
  • Trade Balance (Visible)

The only announcement that was significant was the Trade Balance in the CAD model. The effect of the announcement was a move in the CAD of 24.6 pips (t-stat 1.9, R2 0.39). The effect of the news in this model was -1.42 (t-stat -4.3). Other announcements that were tested for the CAD were:

  • Consumer Price Index (MoM)
  • CPI ex Core 8 (MoM)
  • GDP m/m
  • Net Change in Employement
  • Retail Sales
  • Retail Sales (Ex Auto)
  • Trade Balance

Bottom line for this dataset

Important announcements by currency:

  • GBP – none more than another. Average news effect move 17 pips.
  • CADTrade Balance (24.6 pips); Average news effect move -1.4 pips.
  • EUR - GDP Annualized (37.7 pips); Change in Nonfarm Payrolls (25.1 pips); Existing Home Sales (-24.9 pips); PPI Ex Food and Energy (19.9 pips); Average news effect move -0.2 pips.

Labels: ,

Thursday, November 09, 2006

What News Matters?

It is not news that news moves financial markets. This blog will publish research on how, when, why, and which news moves what financial markets.

Today I will tackle a different data set. The Forex Resource Guide publishes an analysis of how a couple of currencies have moved in response to several economic announcements. The data is in a spreadsheet. I think this site and spreadsheet is due to Tom Yeomans but I am not sure as the site does not credit him. FYI, Tom's blog is here and he has another site here. I took the EUR/USD moves and modelled the move measured in pips.
  • Note: the Forex Resource Guide author warns that: "The 'Move Pips' only represent the maximum length of the move based on my best judgment of what happened because of the economic report numbers."
I explained the move in the EUR with the actual minus expected number for the announcement.
  • Note: the expectation here is a market expectation, that is a survey, not the usual derivative auction-based data that I usually use.
I then included a set of variables to identify which announcement had taken place. Out of a universe of 22 announcements only a few were significant. The statistically significant announcements for the EUR were:
  • GDP Annualized
  • Change in Nonfarm Payrolls
  • Existing Home Sales
  • PPI Ex Food and Energy
For those interested, here are the regression results, sorted by the most significant variable and then by the size of the coefficient:

VARIABLE

COEFFICIENT

STDERROR

T STAT

P-VALUE

SIG LEVEL

ABS(T)

Diff

-0.203241

0.0438242

-4.638

<0.00001

***

4.638

GDP Annualized

37.7114

13.1587

2.866

0.00485

***

2.866

Change in Nonfarm Payrolls

25.098

10.8746

2.308

0.02258

**

2.308

Existing Home Sales

-24.8642

10.8074

-2.301

0.023

**

2.301

PPI ExFood and Energy

19.8623

11.3957

1.743

0.08371

*

1.743

The variable News is the actual minus expected release and is , as expected, very significant. The coefficient on the announcement gives the average size of move from the announcement. So, the EUR moves, on average, 37 pips when the GDP comes out, and 25 pips when the nonfarm payrolls are announced, etc. The data covers a large number of releases, but there is not a lot of history for each release, thus limiting what can be done with it. However, pooling the announcements together gives a decent number of observations (135 for the above analysis) and so allows us to sort the wheat from the chaff for the 22 announcements. I gives traders a tool to help them determine which announcments to focus on. It also might be useful in determining triggers for trading opportunities. This however is beyond my ken. The data also covers the CAD and GBP, is anyone interested in a similar analysis for these currencies?

Labels:

Monday, November 06, 2006

Recent Developments in How Economic Announcements Affect Financial Markets

It is not news that news moves financial markets. What is news is that economic derivatives, auctions of puts and calls on economic releases, allow us to get a much better read on market sentiment than was available previously from surveys. Also real-time financial markets data has allowed the effect of the announcement to be separated from other influences.

This combination of market expectations from economic derivatives and real-time financial market data means that we can now quantitatively estimate how markets will move when economic data are released.

re: Making News Relevant to You A view for the economy that is different from the market is an opportunity to profit. But this opportunity needs information to be realized. You need to know how your financial position will change under different scenarios. The research from relevant economics provides that link, between news and market reaction.

Using derivatives based measures of market expectations and real-time financial data, we quantify what moves, how much, and when so that your insights can be turned into profit.

As an example, the charts show how the EUR and the CHF move in opposite directions when the U.S. trade news is announced.

Expanding Research Coverage

We are researching an expanding group of markets (Gold; AUD; CAD; CHF; EUR; GBP; Heating Oil; JPY; Natural Gas; S&P 500; 2, 5, 10, and 30-Year T-Bonds) and economic announcements (U.S. Retail Sales; Initial Jobless Claims; Non-Farm Payrolls; International Trade Balance; Gross Domestic Product; CPI; ISM Manufacturing PMI Index; Eurozone HICP Inflation Index).

Our focus is, however, driven by client needs, contact me for details.

Labels:

Sunday, November 05, 2006

Is it just me? No - HSBC are in on the act too.

It is not news that news moves financial markets. This blog will publish research on how, when, why, and which news moves what financial markets.

Is it just me that thinks that this research is useful (and profitable)?

Thankfully no. HSBC do too.

Stacy Williams, in a presentation entitled “The Foreign Exchange Market and the Growing Role Of Quantitative Analysis” from 22nd September 2004, mentions that one goal of quantitative analysis is to look at economic surprises. The measurement of the ‘news’ component of macro economic announcements and to identify market moving data releases.

Mr. Williams, Director of Quantitative Strategy and Model Trading - Global Markets, states that there is a:

Wide range of economic and survey data is published for the major economies most weeks

· These data releases clearly have market impact and participants monitor them avidly

· Numbers are generally assessed in a relatively ad hoc way - which is individually and immediately

· Why not do it systematically?

And:

The absolute level of a number may be most relevant for the economy as a whole - payrolls positive or negative ?

· ... but markets have already priced in expectations

· In the market we care about how far from consensus the release is - the ‘surprise' element

· It’s this surprise element which can now systematically monitor

He shows the impact of the Chicago PMI on a financial market (I can’t tell which):

The chart should look familiar to regular readers of this blog. For example,here, or here, or even here.

It is nice to know it is not just me that thinks this is interesting.

Labels:

Friday, November 03, 2006

NFP Revisions, NB?

8:30 A.M. (EST), Friday, November 3, 2006 - Nonfarm payroll employment grew by 92,000 in October following gains of 148,000 in September and 230,000 in August (as revised).The final forecast from economic derivatives auction was 103.9k. As stated yesterday, the range of forecasts from survey data was 120-135 (thousand jobs) with 125k being the favourite prediction but a bit of skew to the upside gives an average forecast, from the surveys, of 127k. So the news (actual minus derivative distribution mean) is -11.9 with the derivatives-based forecast being more accurate than the survey forecasts. That the derivatives-based forecast was more accurate was not unusual, this is usually the case (See for example Gürkaynak & Wolfers - Equity and Bond Market Responses using Survey and Market-Based Expectations Refet S. Gürkaynak, Justin Wolfers, 2005 “Macroeconomic Derivatives: An Initial Analysis of Market-Based Macro Forecasts, Uncertainty and Risk” pdf. As well as being more accurate the derivatives-based number provides more information as I described in the last post.

There was some sentiment today that the revisions meant that although the number was lower than expected (however defined), the revision was above expectations and this might affect financial markets as much or more than the news itself.

So far I have found that the economic derivative-based news is the best predictor of where and how much financial markets move.

The hypothesis about revisions is an easy one to test. I will address this in the near future.

Labels: ,

Thursday, November 02, 2006

Wait for the Signs - The Nov. 3rd 2006 Non-Farm Payrolls Announcement

It is not news that news moves financial markets. This blog will publish research on how, when, why, and which news moves what financial markets.

The non-farm payrolls announcement is due this Friday, November 3rd, at 8:30am. What are some possible scenarios for the market’s reaction?

The Forex Resource Guide lists economic calendars that often provide forecasts of upcoming announcements or market expectations surveys.

This gives us a range of forecasts and market expectations:

Today FX: 125 Briefing.com Forecast 135 Briefing.com Consensus: 125 Bloomberg Consensus: 120 Forex Calendar: 130 MarketWatch: 130 TheStreet (Reuters): 125 Average of Forecasts: 127

So we have a range on 120-135 (thousand jobs) with 125k being the favourite prediction but a bit of skew to the upside gives an average forecast of 127k.

What is wrong with these forecasts?

1. They are sparse. Forecasts that drive financial markets are the expectations that are held by the millions of investors worldwide. The outcome of these expectations can be observed in asset prices and valuations. On the other hand, forecasts are the opinions of a few professionals and surveys usually canvass only a couple of dozen opinion leaders who may represent the mainstream.

2. They are clustered. Forecasters talk to each other and this influences their perspective. While it may pay, in terms of more press coverage, to be slightly controversial, it does not always pay to be an outlier. Most forecasters want their prediction to lie in the middle of other forecasts, most of the time.

3. They don’t answer the question that really interests you. Surveys cover key economic forecasts but do not tell you about the things you really care about, your particular portfolio of financial assets or risk factors affecting your holdings.

What is a better source of information?

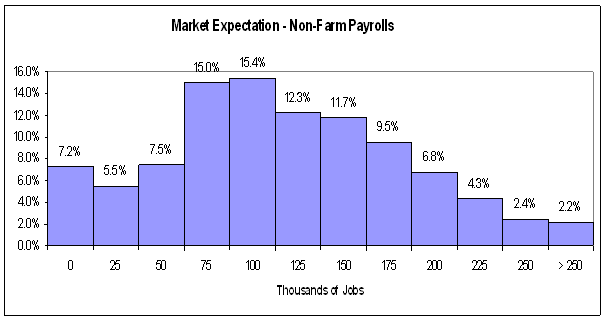
People are putting down real money and betting or hedging the outcome of tomorrow’s non-farm payrolls release. From the derivatives auction for non-farm payrolls I can construct a full distribution of possible outcomes rather than the rather sparse, aggregated forecasts available from market surveys.

Here is what a market comprised of hedge funds and large banks thinks about tomorrow’s release (this is at the time of writing, there will be more bidding and the numbers will change up until 15 minutes before the release):

This chart is also currently available from the CME.

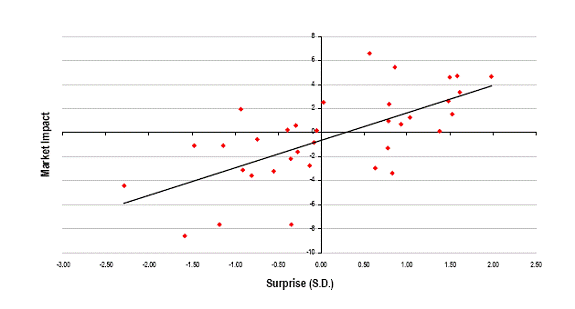
This gives a much richer picture as we can see a much wider dispersion. There is information in this disagreement. Now we can derive scenarios for what will happen in financial markets if the news is different from the mean expectation of 102k.

The 12-month moving average is around 160k, way above the forecasts and surveys. But from the derivatives information we can see that there are a fair number of people betting on a number this high. In fact 37% of the market is expecting a number above the most popular forecast of 125k. If we went with the traditional survey numbers we not be aware of this market sentiment.

Using the historical relationship between surprises in the non-farm payrolls (difference between the actual and the derivative, auction-based market expectation) we can derive a range of scenarios, possible outcomes, for the release on various financial markets.

Surveys of forecasts can be used to develop scenarios for risk management to allow risk managers to understand their potential losses, conditional on a range of forecasts. The average forecast and the range of forecasts can be used to build a model of the distribution of market participants' expectations. The model can then be used to address the problems of sparse and clustered data. For more on how forecasts can be useful there is a paper I wrote a while ago at: "Using forecasts for risk management".

The recent developments in economic derivatives means you no longer have to fit distributions to sparse forecasts. Now you just need to translate the distribution of economic indicator movements into something that is relevant to you.

And this is what this blog is all about.

Labels:

Wednesday, November 01, 2006

Economic Announcement Days vs. No Announcement Days

It is not news that news moves financial markets. This blog will publish research on how, when, why, and which news moves what financial markets. How do announcement days (days on which an announcement of a U.S. economic indicator is made) differ from other days? I looked at 946 days between 2/19/2004 and 9/21/2006. At 8:30am on those days I looked at the EURUSD exchange rate and calculated the one-minute return. I also calculated the absolute change in pips (traders use the movement in the fourth decimal place or the absolute change in price time 10,000). Then I looked at just days on which one of five major announcements was made (retail sales ex-autos, non-farm payrolls, preliminary GDP, initial jobless claims, and the trade balance). All of these announcements are at 8:30am Eastern Time. The returns (pips) for the announcement days was 106 times greater (109 times greater) than for non-announcement days. The range in pips was -101 to 151 versus -30 to 39. Plotting returns both against a normal distribution shows the differences. First announcement days:Notice that there are a lot of returns close to zero on those days that the market anticipated correctly the announcement. But also notice that there are lots of outliers beyond the tails of a fitted normal distribution. For non-announcement days we need to put the chart on the same range to show the distribution on a similar footing:The difference in the distributions is striking, announcement day returns have a huge variance compared to non-announcement days. You can see why hedge funds, traders, and banks think that announcement days are tremendous trading opportunities. This is just looking at returns (or risk) to buying and selling (or holding) the Euro vis. a vis. the U.S. dollar around announcement days. To understand these large moves in the EURUSD exchange rate we must examine the market expectation, the actual release and the relationship between these and the financial markets. For more on this see my previous (or forthcoming) posts.

Labels: