Friday, March 09, 2007

Charts for Survey vs. Derivatives Based Forecast Comparisons

In the last few posts I showed the statistics that show that the economic derivatives forecast outperforms the consensus for the nonfarm payrolls announcement. Here are the charts that go with the stats. First, here is the chart of Actual (U.S. nonfarm payrolls or NFP) versus the economic derivatives or market-based forecast for the last 54 months (2002:01 - 2007:03). Here is the same chart for the Consensus or survey-based forecast: And side-by-side:And here are all three as a time series plot: Here are the forecast errors for the economic derivative or auction market forecasts compared with a fitted normal distribution (you'd hope that the errors were random and reasonably normal in their distribution): And here are the Consensus or survey-based forecast errors: Conclusion? You can't see much from the charts as the two forecast series both track the actual quite well and eye-balling the charts does not suggest one is better than another. However, the statistics of MAE, RMSE, correlation and especially the horse-race regression confirm that the economic derivative or auction market-based forecast outperforms the survey or Consensus forecast and that the latter adds nothing once you have the former.

Labels: , ,

NFP: Superior Derivatives-Based Forecasts - Confirmed

Refet S. Gürkaynak and Justin Wolfers compared the Consensus of Economists or survey-based forecasts with the economic derivatives or market-based forecast using data from Oct. 2002 to Jul. 2005 (33 NFP observations). The results shown are shown below (in the GW columns).

I have replicated their study using more, and overlapping, data from Oct. 2002 to Mar. 2007 (64 observations). My results are shown in the table by the JCP columns.

The conclusion? Again the economic derivatives or auction market-based forecast dominates the Economist survey or Consensus forecast.

Details are found in the table below which looks at measures of forecast accuracy, the mean absolute error (MAE) and the root mean squared error (RMSE). There is also a correlation of each forecast with the actual (NFP release) and a regression-based test of the information content of each forecast using the Fair and Shiller method.

As with the smaller sample in GW, the MAE and RMSE are lower for the economic derivatives forecast. The correlation with the actuals is also higher than the Consensus-based forecast.

The coefficient in the regression should be unity for a good forecast. For the Derivatives or auction market-based forecast the test of the coefficient being equal 1 could not be rejected by GW. The evidence is not as strong now, as the test statistic is: F(1, 51) = 0.235477, with p-value = 0.62957.

The test that the Consensus or survey-based forecast is zero (that is that this forecast adds nothing to explanatory power of the other forecast, or conditioning on the market-based forecast renders the survey forecast uninformative) is: Test statistic: F(1, 51) = 5.62732, with p-value = 0.0214933. So the Consensus adds no information beyond the economic derivative forecast.

Not only that but the perverse negative coefficient found by GW persists with the longer data set.

Again, it seems “likely that the improved performance is due to the market effectively weighting a greater number of opinions, or more effective information aggregation as market participants are likely more careful when putting their money where their mouth is.”

JCP

JCP

GW

GW

Consensus

Economic Derivatives

Consensus

Economic Derivatives

Mean Absolute Error (MAE)

0.812

0.809

0.743

0.723

Root Mean Squared Error (RMSE)

1.036

1.023

0.929

0.907

Correlation of Forecast with Actual

0.7025

0.7026

0.677

0.700

Horse Race Regression (Fair-Shiller)

-0.42

1.26

-0.14

1.06

standard error

0.56

0.53

0.89

0.78

t-statistics

-0.75

2.38

-0.16

1.36

significant at 10% (*), 5% (**), or 1% (***) level

**

R2

0.50

0.46

obs.

54

33

range of data

Oct. 2002 - Mar. 2007

Oct. 2002 - Jul. 2005

Forecast errors normalized by historical (Oct. 2002 to Mar. 2007) standard deviation of survey-based forecasts of 90.31.

Fair-Shiller - Fair, Ray C. and Robert J. Shiller (1990), “Comparing Information in Forecasts from Econometric Models,” American Economic Review, 80(3), 375-89.

GW - Refet S. Gürkaynak and Justin Wolfers (2005), "Macroeconomic Derivatives: An Initial Analysis of Market-Based Macro Forecasts, Uncertainty, and Risk"

Labels: , ,

A Consensus of Economists

How well do economists predict the U.S. nonfarm payrolls? I picked up the consensus forecast for the NFP from the NASDAQ website (from Econoday). The latest report is here.

There are 63 monthly reports back to January 2002 (there may be more but this is all I pulled for analysis), all have actual and the consensus forecast. The most recent 4o reports have the range of the forecasts as well.

The average error was 24,000.

This appears to be a biased forecast (on average the error should be zero. With a standard error or 10,000, this is significantly different from zero at the 95% level). So despite studying the dismal science, economists are overall an optimistic bunch. In fact they are overly optimistic.

The biggest oopsie was 328,000 (in March 2003 when the actual was -308,000 and the expected was 20,000).

In the last 40 months the actual fell within the range of the expectations 20 times. So 50% of the time the actual was inside the range. That is not a great record.

Next, I'll look at the economic derivatives forecast performance and provide some comparisons.

Labels: ,

Nonfarm payroll employment - whose better?

Nonfarm payrolls for February 2007 (released today, Friday March 9th at 8:30am) continued to trend up (+97,000). Details are here. Yesterday I noted that as of yesterday, the Economists' consensus was 100,000 and the CME Auction Market participants' consensus was 82,500. So who is the better forecaster? In this instance the Economists were better (error of 3,000 versus the derivatives auction results error of 14,500). For the Nonfarm payrolls (NFP) there are several forecasts that come from the CME auctions There was one more auction and therefore one more forecast before the release at 8:30am this morning. This auction gave an implied market forecast that was even more off the mark (75,500). I have maintained that, based on my research, over time the CME Auction Market participants' consensus outperforms the Economists' consensus. Gürkaynak and Wolfers (2006) conclude that “The evidence presented … shows that economic derivatives option prices are accurate and efficient predictors of the densities of underlying events” (p. 29). Seems it is time to test that hypothesis again. Here's what I'd like to do. Test:
  • Which forecast best predicts the actual outcome, CME economic derivatives auctions or the Economists' consensus?
  • Since, for the NFP there are several forecasts from economic derivatives auctions, do auctions closer to the release perform better than forecasts that are more stale?
  • Does averaging the auction results produce a superior forecast?
There are a couple of definitions of a better forecast that may be pertinent here. One might be, as implied above, that is which forecast predicts the outcome better. However this assumes that the variable you are interested in is in fact the economic release (such as the NFP). But who really cares about the NFP? What most people care about is what it means to them. These economic statistics are indicators. Most investors care about how these indicators affect their portfolio of holdings. So one definition of a better forecast of NFP might be one that more accurately explains (or forecasts) movements in the financial variable of interest. I'm not sure the data will allow for a definitive test on all of these points, but this is my goal.
  1. Gürkaynak, Refet S., Wolfers, Justin, (2006) “Macroeconomic Derivatives: An Initial Analysis of Market-Based Macro Forecasts, Uncertainty and Risk” NBER Working Paper Series, NBER Working Paper 11929, January 2006.

Labels: , ,

Thursday, March 08, 2007

What Can You Expect from the March Nonfarm Payroll Release?

As I have discussed before in this blog, the best information about an upcoming nonfarm payrolls release comes from the economic derivatives auctions held by the Chicago Mercantile Exchange, Longitude, and ICAP. From the CME: March Nonfarm Payroll Release - Friday, March 9 at 8:30 a.m. EST

Economists' consensus - 100,000

CME Auction Market participants' consensus - 82,500

Based on previous auctions that occurred Tuesday, March 6, Wednesday, March 7 and earlier this morning, CME Auction Market participants predict U.S. employers added 82,500 jobs last month, which is significantly lower than economists' forecasts of 100,000 jobs.

Chart from this morning's CME Auction (March 8, 7:30 a.m. - 8:15 a.m. EST)

Chart from yesterday's CME Auction (March 7, 7:30 a.m. - 8:15 a.m. EST)

Chart from Tuesday's CME Auction (March 6, 7:30 a.m. - 8:15 a.m. EST)

Labels: ,

Wednesday, February 07, 2007

NFP FX Correlation Matrix

It is not news that news moves financial markets. This blog will publish research on how, when, why, and which news moves what financial markets.

On Monday, November 06, 2006 in a post entitled “Recent Developments in How Economic Announcements Affect Financial Markets” I noted that the EUR and the CHF move in opposite directions when the U.S. trade news is announced. I expanded on this in the post on Wednesday, December 27, 2006, “Hidden Relationships” noting that the Swiss Franc and the Euro also appear, on average, to move in opposite directions to the U.S. Dollar when non-farm payrolls are announced.

Then on Friday, January 26, 2007 in "More Hidden Treasures" I looked at how the Yen and the Pound appear, on average, to move in opposite directions to the U.S. Dollar when non-farm payrolls ("NFP") are announced.

These NFP relationship can be encapsulated in a correlation matrix for foreign exchange returns right after the news. Here is the NFP return correlation matrix 1 minute after the announcement:

Announcement NFP
Minute 1
AUD CAD CHF EUR GBP JPY
AUD 1 -0.8692 -0.925 0.9432 0.9136 -0.8767
CAD -0.8692 1 0.8232 -0.8417 -0.832 0.7753
CHF -0.925 0.8232 1 -0.9901 -0.9688 0.8832
EUR 0.9432 -0.8417 -0.9901 1 0.9655 -0.889
GBP 0.9136 -0.832 -0.9688 0.9655 1 -0.9016
JPY -0.8767 0.7753 0.8832 -0.889 -0.9016 1
I have highlighted the correlations previously discussed. But as one can see there are other interesting leverage/hedging opportunities. Note that all of these correlations are significant. The 5% critical value(two-tailed) = 0.2787 for 50 observations (monthly data from Nov 1 2002 i.e. October 2002 release to Dec 8 2006 i.e. November 2006 release). If anyone would like a spreadsheet of my calculation of the 1, 5, 10, 20 and 30 minute return correlation matrices for the U.S. announcements of nonfarm payrolls, initial jobless claims, retail sales, and CPI, please send me an email to john.parkerATrelevanteconomics.com.

Labels: ,

Thursday, February 01, 2007

What Can You Expect from February's Nonfarm Payroll Release?

I received a great email today. The email was from the CME (Chicago Mercantile Exchange).

It gives the market consensus for tomorrow's nonfarm payrolls, the derivative auction expectation for the same, the distribution of the expectation, and the evolution of the expectation over the last few days.

As I have documented in this blog, that information (plus several hundred hours worth of research results that I am supplying) is about all you need.

The economic derivatives news (actual release minus the market expectation from the economic derivative auction) drives financial markets.

You will find a lot of prognostications about the NFP. Trust me, this is the best information there is. Bar none. The information in this email is fatidic, a goldmine of free information.

Here it is:

What Can You Expect from February's Nonfarm Payroll Release? Friday, February 2 at 8:30 a.m. EST

Economists' consensus - 160,000

CME Auction Market participants' consensus - 134,800

Based on previous auctions that occurred Tuesday, January 30, Wednesday, January 31 and earlier this morning, CME Auction Market participants predict U.S. employers added 134,800 jobs last month, which is significantly lower than economists' forecasts of 160,000 jobs.

Chart from this morning's CME Auction (February 1, 7:30 a.m. - 8:15 a.m. EST)

Chart from yesterday's CME Auction (January 31, 7:30 a.m. - 8:15 a.m. EST)

Chart from Tuesday's CME Auction (January 30, 7:30 a.m. - 8:15 a.m. EST)

Upcoming nonfarm payroll auctions that will occur this week include:

Thursday, February 1, 3:00 p.m. - 4:00 p.m. EST Friday, February 2, 7:00 a.m. - 8:00 a.m. EST

Click here to view recent auction activity or visit auctions.cme.com.

*If you have not already registered to view CME Economic Derivative auction results, you will have to fill out a simple registration form.

Introducing the CME Economic Derivatives Weekly Auction Schedule Your weekly schedule of upcoming CME Auction Market dates and times

At CME, we continually seek to expand the information available to market participants and industry partners. Today we want to introduce you to another valuable new tool - CME Economic Derivatives Weekly Auction Schedule - a weekly e-mail that provides you with the dates and times of the CME Economic Derivative auctions for the week.

Click here to subscribe now

For more information on CME Economic Derivatives, please visit: www.cme.com/economicderivatives or call CME Customer Service at 800-331-3332

Labels:

Friday, January 05, 2007

Non Farm Payrolls - January 5th 2007

It is not news that news moves financial markets. This blog will publish research on how, when, why, and which news moves what financial markets.

Yesterday I reported that there seems to be lots of uncertainty leading up to tomorrow’s non-farm payroll announcement. Well, the numbers are in and Nonfarm employment increased by 167,000 in December.

Derivatives-based expectations had been declining for the last few days with the auction just before the announcement giving a market forecast of 77,9000. The market surveys were anticipating 100,000-115,000 but with some risk on the downside -" optimistic given the recent weakness in other jobs data" and"but this might prove to be tooa lot of people were looking for a nasty number because the ADP jobs report said the economy LOST 40,000 jobs." This sentiment was captured in the distribution of expectations:

My research suggests that the news that will drive the market this morning will be the 89,100 surprise (167,000 minus 77,900).

The uncertainity indicator information from the derivatives auction was correct - this one surprised the markets.

Labels:

Thursday, January 04, 2007

Caveat Emptor - Tomorrow's Dec. 2006 Non-Farm Payrolls Announcement

It is not news that news moves financial markets. This blog will publish research on how, when, why, and which news moves what financial markets. *** Updated 4:00pm EST at the close of the CME Economic Derivative auction ***

There seems to be lots of uncertainty leading up to tomorrow’s non-farm payroll announcement.

Below are the results from the economic derivative auctions that give the best market expectation for tomorrow. I have included in the table the time and date of the auction that gives the market expectation and the historical average from previous auctions:

The Employment Situation, December 2006

Changes in Non-farm Payrolls 8:30am Jan. 5 2007

Wednesday,

January 3, 2007

Thursday,

January 4, 2007

Thursday,

January 4, 2008

Historical Average

8:00 AM EST

8:15 AM EST

4:00 PM EST

Forward Price

112.73

87.35

85.38

Implied Distribution Statistics

Mean

113.1

87.8

85.8

131.5

Volatility

290.7

315.3

318.2

87.5

Skew

0.0

0.3

0.3

0.6

Kurtosis

-1.3

-1.2

-0.9

0.2

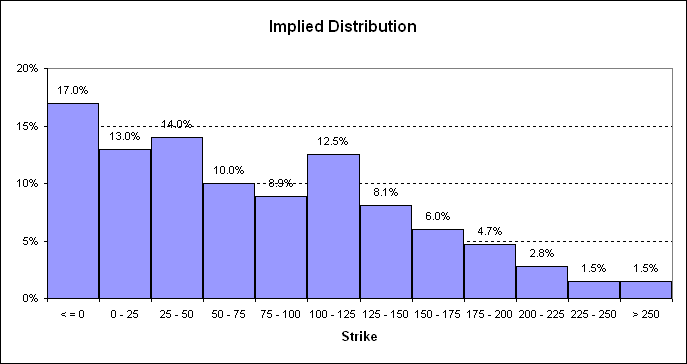
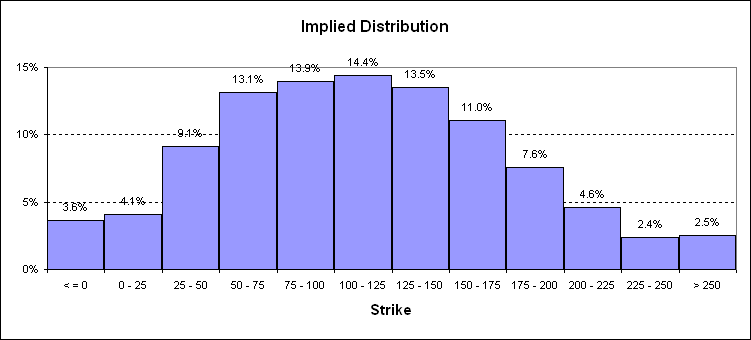
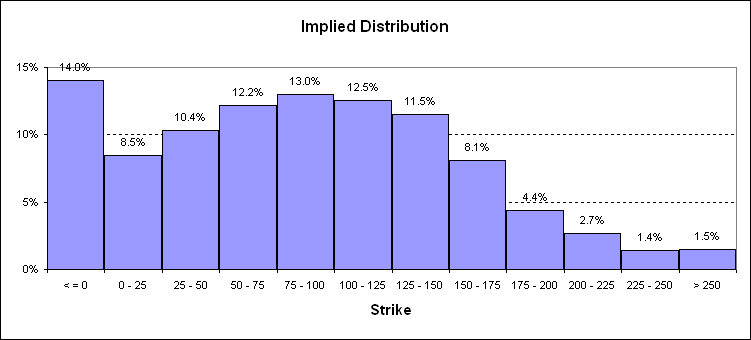
Notice that the mean forecast has moved from 113 to 85 since yesterday.

But look at the volatility. Yesterday it was 290, today it is 318 (3.6 times the average historical volatility of 87).

Here is the implied distribution from yesterday:

And here is the implied distribution from this morning:

And here is the implied distribution from this afternoon:

Look at the latest distribution. The calculated average (from the put and call prices) published on the CME website is 85.8 thousand jobs but the mode is for no growth in jobs (a derivative strike price of 0 jobs).

A dispersion in expectations means that there is more uncertainty than usual in the market. This could be good or bad depending on your perspective.

There is one more auction (7-8am) in advance of the release at 8:30am tomorrow. If you are interested, the link to the auction results is here.

Labels:

Friday, November 03, 2006

NFP Revisions, NB?

8:30 A.M. (EST), Friday, November 3, 2006 - Nonfarm payroll employment grew by 92,000 in October following gains of 148,000 in September and 230,000 in August (as revised).The final forecast from economic derivatives auction was 103.9k. As stated yesterday, the range of forecasts from survey data was 120-135 (thousand jobs) with 125k being the favourite prediction but a bit of skew to the upside gives an average forecast, from the surveys, of 127k. So the news (actual minus derivative distribution mean) is -11.9 with the derivatives-based forecast being more accurate than the survey forecasts. That the derivatives-based forecast was more accurate was not unusual, this is usually the case (See for example Gürkaynak & Wolfers - Equity and Bond Market Responses using Survey and Market-Based Expectations Refet S. Gürkaynak, Justin Wolfers, 2005 “Macroeconomic Derivatives: An Initial Analysis of Market-Based Macro Forecasts, Uncertainty and Risk” pdf. As well as being more accurate the derivatives-based number provides more information as I described in the last post.

There was some sentiment today that the revisions meant that although the number was lower than expected (however defined), the revision was above expectations and this might affect financial markets as much or more than the news itself.

So far I have found that the economic derivative-based news is the best predictor of where and how much financial markets move.

The hypothesis about revisions is an easy one to test. I will address this in the near future.

Labels: ,

Thursday, November 02, 2006

Wait for the Signs - The Nov. 3rd 2006 Non-Farm Payrolls Announcement

It is not news that news moves financial markets. This blog will publish research on how, when, why, and which news moves what financial markets.

The non-farm payrolls announcement is due this Friday, November 3rd, at 8:30am. What are some possible scenarios for the market’s reaction?

The Forex Resource Guide lists economic calendars that often provide forecasts of upcoming announcements or market expectations surveys.

This gives us a range of forecasts and market expectations:

Today FX: 125 Briefing.com Forecast 135 Briefing.com Consensus: 125 Bloomberg Consensus: 120 Forex Calendar: 130 MarketWatch: 130 TheStreet (Reuters): 125 Average of Forecasts: 127

So we have a range on 120-135 (thousand jobs) with 125k being the favourite prediction but a bit of skew to the upside gives an average forecast of 127k.

What is wrong with these forecasts?

1. They are sparse. Forecasts that drive financial markets are the expectations that are held by the millions of investors worldwide. The outcome of these expectations can be observed in asset prices and valuations. On the other hand, forecasts are the opinions of a few professionals and surveys usually canvass only a couple of dozen opinion leaders who may represent the mainstream.

2. They are clustered. Forecasters talk to each other and this influences their perspective. While it may pay, in terms of more press coverage, to be slightly controversial, it does not always pay to be an outlier. Most forecasters want their prediction to lie in the middle of other forecasts, most of the time.

3. They don’t answer the question that really interests you. Surveys cover key economic forecasts but do not tell you about the things you really care about, your particular portfolio of financial assets or risk factors affecting your holdings.

What is a better source of information?

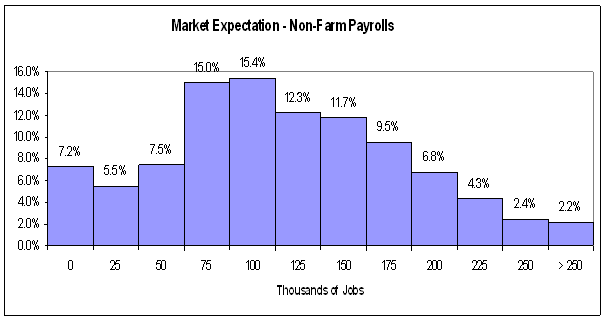
People are putting down real money and betting or hedging the outcome of tomorrow’s non-farm payrolls release. From the derivatives auction for non-farm payrolls I can construct a full distribution of possible outcomes rather than the rather sparse, aggregated forecasts available from market surveys.

Here is what a market comprised of hedge funds and large banks thinks about tomorrow’s release (this is at the time of writing, there will be more bidding and the numbers will change up until 15 minutes before the release):

This chart is also currently available from the CME.

This gives a much richer picture as we can see a much wider dispersion. There is information in this disagreement. Now we can derive scenarios for what will happen in financial markets if the news is different from the mean expectation of 102k.

The 12-month moving average is around 160k, way above the forecasts and surveys. But from the derivatives information we can see that there are a fair number of people betting on a number this high. In fact 37% of the market is expecting a number above the most popular forecast of 125k. If we went with the traditional survey numbers we not be aware of this market sentiment.

Using the historical relationship between surprises in the non-farm payrolls (difference between the actual and the derivative, auction-based market expectation) we can derive a range of scenarios, possible outcomes, for the release on various financial markets.

Surveys of forecasts can be used to develop scenarios for risk management to allow risk managers to understand their potential losses, conditional on a range of forecasts. The average forecast and the range of forecasts can be used to build a model of the distribution of market participants' expectations. The model can then be used to address the problems of sparse and clustered data. For more on how forecasts can be useful there is a paper I wrote a while ago at: "Using forecasts for risk management".

The recent developments in economic derivatives means you no longer have to fit distributions to sparse forecasts. Now you just need to translate the distribution of economic indicator movements into something that is relevant to you.

And this is what this blog is all about.

Labels:

Wednesday, October 11, 2006

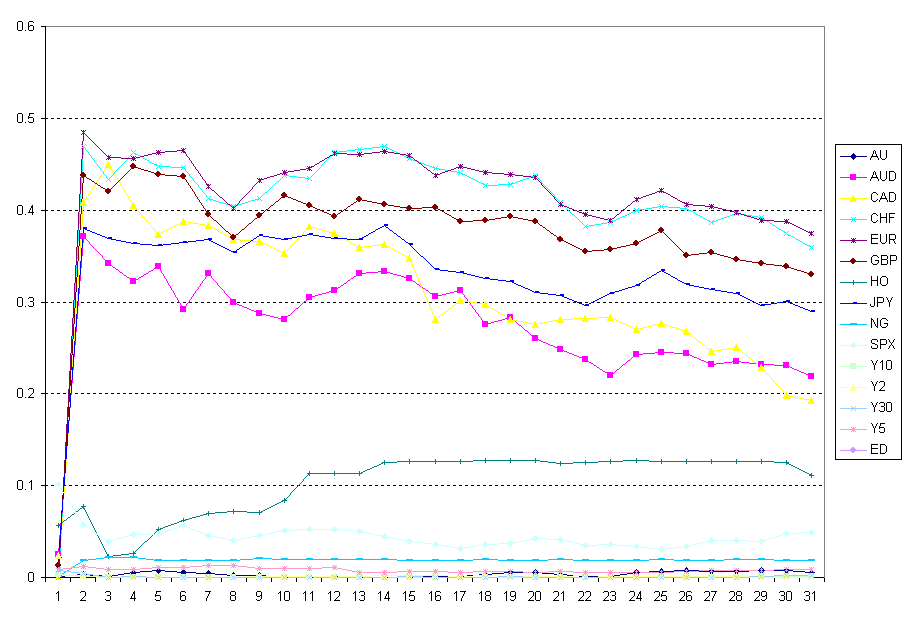
How Quickly Do Markets Respond to NFPs?

It is not news that news moves financial markets. This blog will publish research on how, when, why, and which news moves what financial markets.

How quickly do financial markets react to news - specifically the Non-Farm Payrolls ("NFP") news?

To answer this, I started with the U.S. non-farm payrolls data as this was found by others to be a significant announcement. For a group of commodities, exchange rates, bond, and equity prices regressions were run of the form:

Xi,j,ti,jNj,ti,j,t

Where i is an index of how many periods are included in the cumulative return calculation from 1 to 31; j is an index of financial markets from 1 to 14 (where the markets are: Gold; AUD; CAD; CHF; EUR; GBP; Heating Oil; JPY; Natural Gas; S&P 500; 2-Year T-Bond; 5-Year T-Bond; 10-Year T-Bond; 30-Year T-Bond), N the news or surprise in the announcement as measured by the difference of the actual from the mean of the economic derivative-based expectation.

Charting, in the Figure below, the Adjusted R2 (which is the same as the R2 in this case), a couple of findings become clear.

R2 For Announcement Effect Regressions For Various Financial Markets for Non-Farm Payrolls – Cumulative Returns

  1. The maximum correlation is often immediate, one minute after the announcement at 8:31am.(Note that on the chart this corresponds to the interval 2 since 1 represents the cumulative return from the 8:29am close to the 8:30am close).
  2. The news effect is often very significant in these regressions.
  3. The markets group quite distinctly into:
  • Commodities (excluding Heating Oil) equities and bonds that have an R2 of 0.1 or less. Heating Oil that rises to an R2 of 0.12 after 15 minutes.
  • Foreign exchange rates that have R2 ’s that peak between 0.35 and 0.5 1 minute after the announcement and decline thereafter.

The 30-Year Treasury has the lowest correlation, the EUR/USD exchange rate the highest.

It is clear from the above that researchers using a 25-30 minute announcement window, or 5-minute returns, will find a relationship but that higher frequency data narrowing the window maximizes the news effect.

The flowers? Non very seasonal but it was pooring rain this a.m. and I thought some spring flowers might brighen up the site on a gloomy, wet, autumn day.

Labels: