Friday, February 09, 2007

See Me Perform - Live and In-Person

This is an early warning that I will be giving a presentation on the impact of news on financial markets to the Toronto Association for Business and Economics (TABE).

  • Location: Bank of Montreal - BMO Boardroom, 21st Floor, 1 First Canadian Place, King St. West and Bay Street, Toronto (map)
  • Date: Thursday April 5, 2007
  • Time: 12 noon to 2 p.m.
  • Cost: TABE and CABE members in good standing around $25-30, others $45-50. A light lunch will be available.
  • Registration: Closer to the date you will be able to book on-line at: www.cabe.ca/chapters/TABE. Or you can call 905-845-3102 or E-Mail tabe@cabe.ca.
  • TABE Members (only) may pay cash or cheque at the door, non-members and credit card payments (VISA, Diners/EnRoute, MasterCard, or American Express) are to be prepaid via the web site. No-shows will be invoiced. Charges include GST. (TABE GST number: R124389990).

Labels: , , ,

Saturday, December 02, 2006

Thresholds, Tipping Points, Good & Bad News

It is not news that news moves financial markets. This blog will publish research on how, when, why, and which news moves what financial markets.

Traders often will set threshold for action and in aggregate this might explain why some announcements are a “scratch” from a trader’s perspective that is there is a move but not enough to act upon. Once the threshold is breached though, lots of people want in.

The move from disorder to order or the contagion effect has been used to explain financial crises. Perhaps it can also be used to explain markets reactions to news too.

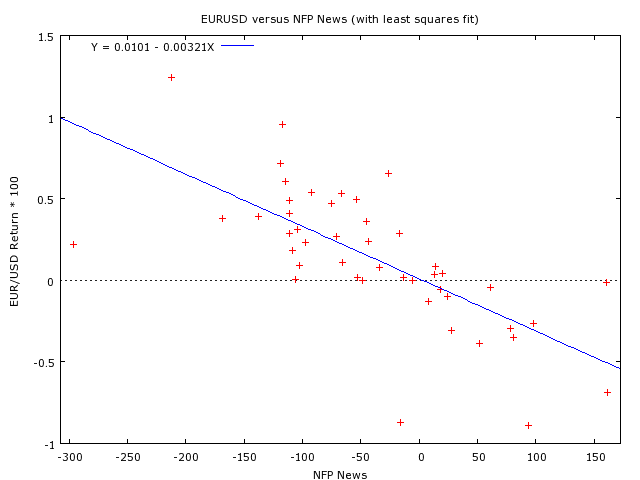
Looking at the impact of the Non-Farm Payrolls (“NFP”) announcements in the U.S. on the Euro (EURUSD) exchange rate, a couple of thresholds appear to be important. Interestingly the threshold is larger for bad news than for good news.

Good news and bad news have different effects also the skew of the expectations is important. These effects have been discussed before but if the news is very good or exceptionally bad there is an extra kicker. So, negative news is more likely to be a non-event than good news from a trading perspective.

The thresholds that were found to be statistically significant were when news was greater than one standard deviation and when news was less than two standard deviations from what was expected (as measured by the economic derivatives auction for NFP).

Labels: , ,

Thursday, November 09, 2006

What News Matters?

It is not news that news moves financial markets. This blog will publish research on how, when, why, and which news moves what financial markets.

Today I will tackle a different data set. The Forex Resource Guide publishes an analysis of how a couple of currencies have moved in response to several economic announcements. The data is in a spreadsheet. I think this site and spreadsheet is due to Tom Yeomans but I am not sure as the site does not credit him. FYI, Tom's blog is here and he has another site here. I took the EUR/USD moves and modelled the move measured in pips.
  • Note: the Forex Resource Guide author warns that: "The 'Move Pips' only represent the maximum length of the move based on my best judgment of what happened because of the economic report numbers."
I explained the move in the EUR with the actual minus expected number for the announcement.
  • Note: the expectation here is a market expectation, that is a survey, not the usual derivative auction-based data that I usually use.
I then included a set of variables to identify which announcement had taken place. Out of a universe of 22 announcements only a few were significant. The statistically significant announcements for the EUR were:
  • GDP Annualized
  • Change in Nonfarm Payrolls
  • Existing Home Sales
  • PPI Ex Food and Energy
For those interested, here are the regression results, sorted by the most significant variable and then by the size of the coefficient:

VARIABLE

COEFFICIENT

STDERROR

T STAT

P-VALUE

SIG LEVEL

ABS(T)

Diff

-0.203241

0.0438242

-4.638

<0.00001

***

4.638

GDP Annualized

37.7114

13.1587

2.866

0.00485

***

2.866

Change in Nonfarm Payrolls

25.098

10.8746

2.308

0.02258

**

2.308

Existing Home Sales

-24.8642

10.8074

-2.301

0.023

**

2.301

PPI ExFood and Energy

19.8623

11.3957

1.743

0.08371

*

1.743

The variable News is the actual minus expected release and is , as expected, very significant. The coefficient on the announcement gives the average size of move from the announcement. So, the EUR moves, on average, 37 pips when the GDP comes out, and 25 pips when the nonfarm payrolls are announced, etc. The data covers a large number of releases, but there is not a lot of history for each release, thus limiting what can be done with it. However, pooling the announcements together gives a decent number of observations (135 for the above analysis) and so allows us to sort the wheat from the chaff for the 22 announcements. I gives traders a tool to help them determine which announcments to focus on. It also might be useful in determining triggers for trading opportunities. This however is beyond my ken. The data also covers the CAD and GBP, is anyone interested in a similar analysis for these currencies?

Labels:

Tuesday, October 31, 2006

The News Impact Curve (Modified)

It is not news that news moves financial markets. This blog will publish research on how, when, why, and which news moves what financial markets.

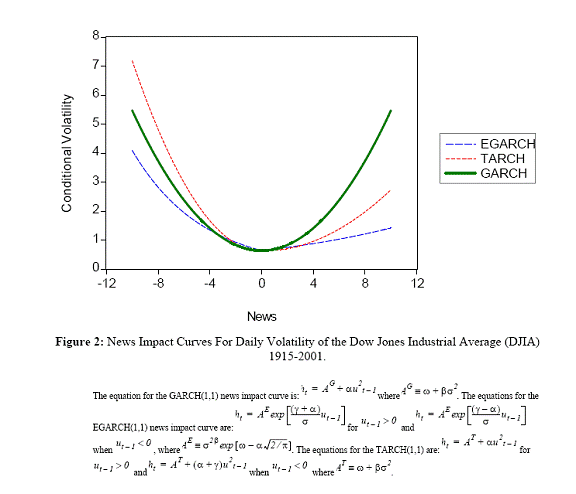
News drives the market. Good news lifts the market. Bad news dampens growth. The effect, however, is not symmetric: good news does not lift the market as much as bad news depresses it; good (bad) news does not lift (depress) a bull market as much as a bear market. Positive and negative stock return innovations have different impact on the volatility, as found in the literature by many researchers, for example Campbell and Hentschel (1992) and Engle and Ng (1993). Volatility following bad news is found to be higher than following good news. This is the well documented predictive asymmetry effect in stock market, which is sometimes called the leverage effect. Besides that good and bad news influences volatility differently, good news in a bull market may not lift up the market as much as in a bear market or vice versa. Intuitively, given a continuous downward market movement, bad news may drag down the market more than if there has been upward market movement. In other words, in a bear market, the market is waiting for bad news and bad news shakes market confidence more than if it has been a bull market. Although some volatility models, mainly in the regime switching context, have allowed for a bull and bear market effect, for example the switching regime GARCH models by Hamilton and Susmel (1994) and Cai (1994), the literature so far has not considered the asymmetric impact of good and bad news in bull and bear markets, which I found to be significant in a paper entitled "How Bad is Bad News; How Good is Good News?". Rob Engle got a Nobel prize for his work on volatility models. Volatility tends to be clustered together, that is there are periods of volatility storms and calms, in which, large squared returns tend to be followed by large squared returns. Engle and Ng (1993) have suggested, for these conditional volatility models, a standard measure of how news influences stock volatility, a news impact curve. Given information up to current time, the news impact curve examines the relationship between the news and future volatility. The news impact curve plots news scenarios, that is a range of bad and good news, on the horizontal axis, against the resulting volatility. Here are some News Impact Curves for the Dow Jones (estimated daily from 1915-2001), showing how volatility responds to good (right side of the chart) and bad news (left side of the chart):

Figure 2 (which, in Firefox at least, can be expanded by clicking on it and then you can zoom in for a closer view) shows the general characteristics of news impact curves, that GARCH model is symmetric around zero, whereas TARCH and EGARCH are asymmetric, with different slopes.

An alternative to the differing slopes of the EGARCH and TARCH models is the asymmetric GARCH (AGARCH) model by Engle (1990) (The AGARCH model is called Quadratic GARCH in Campbell and Hentschel (1992)).

OK, so much for the build up, but this is not really news. It has been well documented that news creates volatility. But here is the news - news moves returns. Using the right market expectations measure and the right time horizon for returns, we can show that returns (as well as squared returns) move predictably when the market is surprised. Here is a news impact curve for the EUR returns (rather than for volatility) responding to non-farm payrolls news: While the news impact curve for volatility was defined some time ago, I think the same curve for the first moment is more interesting than that for the second moment. Don't you? I'll be concentrating on the movement in the first moment, that is returns in financial markets. And in coming posts I'll show how some very simple, naive, rules can be used in combination with the (modified) news impact curve.

References

Cai, J. (1994). A Markov Model of Switching-Regime ARCH. Journal of Business & Economics Statistics, 12, 309-316.

Campbell, J.Y. and L. Hentschel (1992). No news is good news: an asymmetric model of changing volatility in stock returns, Journal of Financial Economics, 31, 281-318.

Engle, R.F. (1990). Discussion: stock market volatility and the crash of 87. Review of Financial Studies, 3, 103-106.

Engle, R.F. and V.K. Ng (1993). Measuring and testing the impact of news on volatility. Journal of Finance, 48(5), 1749-78.

Hamilton, J.D. and Susmel, R. (1994). Autoregressive Conditional Heteroskedasticity and Changes in Regime. Journal of Econometrics, 64, 307-334.

Labels:

Thursday, October 19, 2006

Does Bad News Matter More Than Good?

It is not news that news moves financial markets. This blog will publish research on how, when, why, and which news moves what financial markets.

Bad news tends to have a bigger impact than good. Running a regression of the returns from futures on the S&P 500 index for 5 minutes before to 25 minutes after the data release on the derivatives-based non-farm payroll news gives:

S&P 500 Index

News Coefficient

Standard Error

t-Statistic

R2

Derivatives-Based News

0.00311

0.00082

3.78

0.3091

The same intraday regression as above is run but splitting the news effect into two (one when the news is a positive surprise and the other when the released number is less than expected):

S&P 500 Index

News Coefficient

Standard Error

t-Statistic

R2

Negative News

0.00331

0.00110

3.01

0.3108

Positive News

0.00285

0.00128

2.22

There is a slight overall improvement in fit (although the standard error increases and adjusted R2 falls). Depending on the application of the results the difference in the estimated average effect for positive and negative of 0.00311 and the 0.00331 for good and 0.00285 for bad may be enough to justify the differentiation.

Labels: ,

Thursday, October 12, 2006

Standardized News

It is not news that news moves financial markets. This blog will publish research on how, when, why, and which news moves what financial markets.

Comparing Different News Consistently

Timing of the announcements matter, some are more important than others.

Andersen et. al.* show that some announcements “… are to some extent redundant, and the market then only reacts to those released earlier.’ (p. 13).

Andersen et. al. note that “although closely timed news events are highly correlated, the correlation does not create a serious multicollinearity problem except in a few specific instances. For example, industrial production and capacity utilization are released at the same time, and they are highly correlated (0.64). In general, however, the event that two announcements within the same category (e.g., real activity) are released simultaneously is rare.” (p. 11)

I investigate which announcements matter and confirm that some announcements matter a lot; some seem to have a marginal impact, while others do not matter.

To do this it is helpful to follow Andersen et. al. and define standardized news (S) as the surprise divided the sample (for each announcement) standard deviation of the news (σ):

Nt = At - Et-δ(At)

St = Nt / σ

Standardized news allows for comparisons of responses of different asset prices to different news.

There is a lot of news. Even if we restrict our attention to those announcements for which there are economic derivative prices there were 231 announcements in the last four years (note that this is not a traditional line chart as there are sometimes two announcements on the same day):

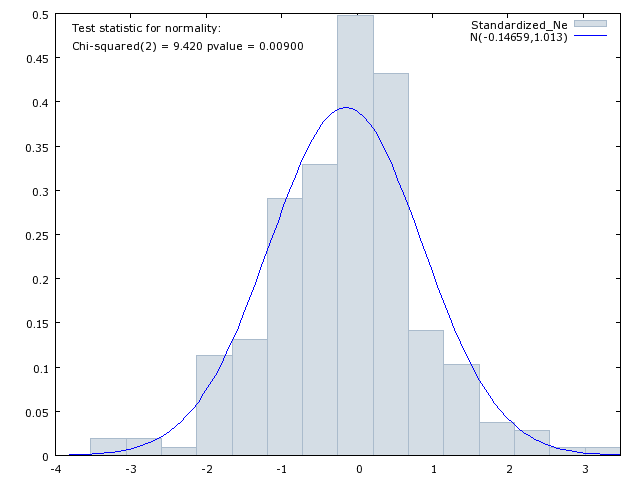
Here is what standardized news looks like (for 7 announcements all together) if you do a frequency plot of the data against a normal distribution:

  • An aside - This is a plug for a nice little FREE econometrics package that produced the above chart. The package is called Gretl (Gnu Regression, Econometrics and Time-series Library).

With news standardized we can compare how a big non-farm payrolls (NFP) surprise compares to a big retail sales news announcement. And, with them both on the same footing, we can say which one is more important.

Of course importance depends on your perspective. If NFP news moves the U.S. 30-Year Treasury bond futures contract but not the foreign exchange market and you are an FX trader then why should you care?

So to be relevant I need to address which news is important (relative to other news), but also which news is important for which markets.

Here is the reference:

*Andersen, Torben G., Bollerslev, Tim, Diebold, Francis X., Vega, Clara, (2002) “Micro Effects of Macro Announcements: Real-Time Price Discovery in Foreign Exchange” NBER Working Paper Series, NBER Working Paper No. 8959, May 2002. pdf link.

Labels:

Monday, October 09, 2006

What's News?

It is not news that news moves financial markets. This blog will publish research on how, when, why, and which news moves what financial markets.

The announcement effect is defined as the impact of news on financial markets. News is defined as the difference between the market’s expectation of the release and the actual release (before any revision).

Theory tells us that it is only news or the surprise component of a release that moves financial markets. The definition and measurement of news is therefore critical.

News (N) or surprise at time t is the actual released data (A) at time t minus the market expectation (E(A)) close to, but before, time t (δ> 0 but small, so the expectation is measured perhaps a few hours or at most a day or two before the announcement).

Nt = At – Et-δ(At)

In the case of economic derivatives, since 2003 the auction data I have used has come from the same day as the announcement. So for example the auctions on U.S. GDP will take place on Friday, October 27th (from 7 - 8am Eastern Time) and the release will be the same day at 8:30am.

In the early days of studying the announcement effect (early to mid-80's) researchers used model-based measures of market expectations. They used autoregressive models, modelling expectations as a weighted average of lagged actual data. Then came the theory of rational expectations and people realized that these models assumed irrational behaviour.

When I was writing my thesis I was exploring the idea of a compromise between rational expectations as an equilibrium condition and an autoregressive mechanism as a learning method to get to this equilibrium. A Kalman filter provided a useful mechanism to describe how the market learns.

Later people took existing surveys that asked people whow they felt about inflation or economic growth and turned this into quantitative information that could be used in econometric models.

Then firms began to survey market participants specifically for a number, a forecast of an upcoming release.

Since 1980 MMS International surveyed around 40 market participants weekly (in the U.S., 20 for the Canadian survey) for their forecasts of major economic indicators. The forecast medians are sold by Haver Analytics under a lease they signed with MMS. MMS no longer exists. MMS’s successor company is Action Economics.

For the Retail Sales (excluding autos) April 2005 release the following information was available from the survey: mean (and median) 0.5, standard deviation 0.3986. The standard deviation and mean are from Gürkaynak and Wolfers (2006). MMS published only the medians. Action Economics, from December 2003, provide mean, median, high, low, number of participants and standard deviation.

Survey data are available for the U.S. Canada Europe for a wide range of forecasts including: Policy Indicators; National Accounts Data: GDP, Consumption & Income; Industrial Production, Capacity Utilization; Housing Indicators; Consumer, Producer, Import, and Export Prices; Employment & Earnings; Manufacturing & Trade; International Trade; and Leading Indicators.

Since October of 2002 Goldman Sachs (Deutsche Bank is also listed as originators of these auctions) have held auctions for Economic Derivatives, the name they give to options on scheduled macro-economic statistics. The auctions are held with the Chicago Mercantile Exchange (CME) and recent auction results are published on the Goldman Sachs and CME web sites.

In these auctions, one can buy and sell options on economic data releases such as employment, retail sales, industrial production, trade balance, inflation, consumer sentiment and economic growth. The auctions typically last for about an hour and take place on the morning before or a few days before the release. To trade in the auctions one must have over $10 million in assets. There are some 120 participants (Estimates from a conversation with Goldman Sachs Economic Derivatives Group on September 11th 2006) in these auctions. At any auction there are 40 or so participants, some 80% or so of these are large and small hedge funds. Large investment banks and a couple of corporations make up the rest. The investment banks, while accounting for less 20% of the participants make up for more than 20% of the auction volume. The participants are split almost equally between the U.S. and Europe (with the majority of European companies being U.K.-based).

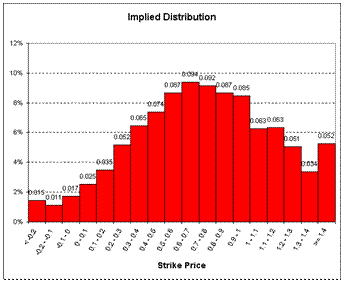
Goldman Sachs’ Economic Derivatives provide an advantage over other expectations measures in that from the auction results one can construct a probability density function of the market’s expectation for the economic release. On the left below is an example from the Retail Sales (excluding autos) auction of May 12, 2005 (for the same April 2005 release for which the survey data is given above). The implied distribution for the retail sales announcement can be generated from the reported auction clearing prices for the digital puts, calls, or digital ranges.
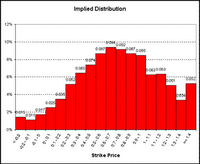
Having expectations measured by a complete distribution has some advantages as we can test whether higher moments than the mean affect financial markets (such as the volatility, the skewness, and kurtosis).

As discussed above the expectation is taken just before the announcement (the closer the better). For the econoimc derivatives covered announcements, if δ is measured in days, the on average δ = 0.1 (excluding the HICP auctions which are 1 and 2 month options – as can be seen from the table below I have access to the 1-month option results).

RSX

ISM

ITB

GDP

NFP

IJC

HICP

All

All (excl. HICP)

Number of Announcements

40

45

19

7

46

32

38

227

Average δ (days)

0.3

0.3

0.0

0.0

0.2

0.0

33.8

4.9

0.1

First Announcement

Sept. 04

Nov. 02

Feb. 05

Jan. 05

Nov. 02

Feb. 04

May 03

Last Announcement

Aug. 06

Sept. 06

Aug. 06

Jul. 06

Aug. 06

Sept. 06

Aug. 06

Summary – Expectations Data

Apart from proving more information the Economic Derivatives or market-based forecasts are found by Gürkaynak and Wolfers to outperform the survey data. They:

“… establish that the Economic Derivatives forecast dominates the survey forecast (although survey forecasts perform quite well) both in predicting outcomes and in predicting market responses to economic news.” (p. 13)

And,

· “… that central tendencies of market-based forecasts are very similar to, but more accurate than surveys. Further, financial market responses to data releases are also better captured by surprises measured with respect to market-based expectations than survey-based expectations, again suggesting that they better capture investor expectations. Some behavioral anomalies evident in survey-based expectations – such as forecastable forecast errors – are notably absent from market-based forecasts.” (p. 1)

The Federal Reserve Board of San Francisco (2006) (Wolfers) took data from the first 153 of these Economic Derivatives auctions and compared them with an alternative forecast aggregator: the survey of the expectations of financial market analysts taken on the Friday prior to the data release. They asked “which better predicts the actual data?” The Economic Derivatives forecasts were slightly (5%–10%) more accurate, although these differences were not statistically significant. They also found more interestingly, once one knows the Economic Derivatives forecast, there is no useful information in the survey-based forecast.

They also analyze the change in stock and bond prices from 5 minutes before the announcement to 25 minutes later for the two alternative measures of news. In each case, they confirm that the Economic Derivatives market better predicts financial market responses to economic data than does the alternative survey-based measure.

Derivatives data is available for 7 series with the longest history going back monthly to September 2002. Survey data is available for some 170 series with the longest history going back weekly to 1980.

While the Economic Derivatives data is superior in terms of information content and usefulness for measuring the announcement effect, the survey data has a longer history and broader coverage. I use the economic derivatives data.

So "What's News?" Well I say it is the difference between what a financial market expects (and has built into prices) as measured by the implied forecast of an economic derivative auction and the actual release. A bit of a mouthful, but a useful definition nonetheless.

Labels:

Thursday, October 05, 2006

News Moves Markets

It is not news that news moves financial markets.

Financial news is full of stories about how markets were surprised or anticipated an economic statistic and how the markets moved in response to this news.

Many people trade in financial markets around economic announcements. These traders like the volatility that surrounds the announcement, so people bet on good news, others on bad, and there is much speculation on what the market sentiment is before a new economic statistic such as the U.S. employment situation that is embodied in the monthly non-farm payrolls release.

Of course just as some want to profit from these market gyrations others see the market moves following news as a risk and would like to avoid them.

In the past surveys have been done of market forecasters before economic announcements. These have been used to gauge market sentiment and the extent to which the actual number differs from the survey is taken as the news component that drives the market in the minutes following the announcement.

New News

Recently two developments have occurred that have allowed us to quantify how much, when, and in what direction financial markets move in response to news.

Firstly, economic derivatives, auctions of puts and calls on economic releases allow us to get a much better read on market sentiment than comes from surveys. Participants in the economic derivatives market are putting their money where their mouth is.

Secondly real-time financial markets data has allowed the effect of the announcement to be isolated and separated from other influences.

The economic-news Blog

This blog will publish relevant research on how news moves financial markets.

The picture? Nice isn't it? More interesting photos to come ...

Labels: